Enhancing Data Quality and Improvement in Meteorological Observations at Bureau of Meteorology Australia
200 likes | 331 Vues
This document outlines the components and operations of the Data Quality and Improvement Section within the Bureau of Meteorology Australia, emphasizing metrology standards and various monitoring programs such as solar and terrestrial radiation, ozone measurement, and climate observations. It highlights the importance of instrument verification, calibration processes, and compliance with international standards, contributing to accurate and reliable atmospheric data collection for meteorological research and environmental monitoring.

Enhancing Data Quality and Improvement in Meteorological Observations at Bureau of Meteorology Australia
E N D
Presentation Transcript
Data Quality & Improvement SectionObservations and Engineering BranchBureau of MeteorologyAustraliaBruce Forgan
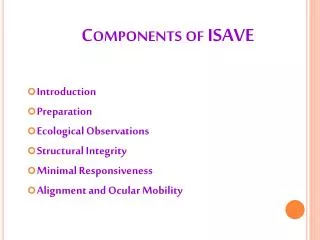
Components of DQ&I • Standards Group == Regional Instrument Centre – metrology • Region V Radiation Centre • Region V Ozone Centre • GAW and Data Delivery Group • Solar and Terrestrial Radiation Network • Ozone Networks • RADAR and Wind Profilers • AMDAR + surface based aviation (ceilometers) • Sea level tsunami • Lightning • Satellite Applications (Solar, NDVI, Wind etc) • Cape Grim Baseline Air Pollution Station (GAW)
Bureau Weather Observation Networks RADAR Coverage 59
Bureau Weather Observation Networks Staffed field offices 57with upper air flights Rainfall (real-time) 2810 Rainfall (climate) 4706
Total Column Ozone • Dobsonspectrophotometers • manual • 3-4 periods/day • Umkehr (dawn) • UV spectrometers • automatic • fixed solar angle • WAN-based • data entry • data distribution
Cape Grim Baseline Air Pollution StationGlobal Atmosphere Watch Measurement Programs Meteorology Precursors to New Particles Phytoplankton (University of Tasmania) Non-CO2 Greenhouse Gases (10+) Carbon Dioxide and Isotopes Radon Reactive Gases (Ozone and NOx) Particles Multiphase Aerosol Chemistry Solar and Terrestrial RadiationUV Radiation (& OH) Archive tanks Higher degree scholarships(2 per annum)
Maintenance of physical standards Maintenance and development of standard practices through: Uncertainty analysis Specifications Instrument verification (& calibration) NATA accreditation(ISO 17025) Traceable hierarchies OEB facility at Broadmeadows Instrument test reports Technical notes External publications Issues verified instruments to network pressure temperature rainfall humidity ozone solar/UV & terrestrial radiation Instrument and observing protocols Education on measurement uncertainty Instrument and process development In-situ training (+ students) Standards Group & ARIC
Main GroupsDependent on DQ&I Section Outputs • Bureau of Meteorology • Traceability of all observations (Regional Instrument Centre) where applicable • National Climate Centre – specialist climate observations • Satellite applications • NATA & Australian & NZ Solar Community • Commercial calibrations • Auditors on meteorological metrology • Standards Australia • Metrology standards for environmental monitoringAustralian standard on solar and terrestrial radiation • World Meteorological Organization • Region V (SW Pacific) Australian Regional Instrument Centre ++ • Global Climate Observing System • Commission for Instruments and Methods of Observation • Global Atmosphere Watch (GAW) • IPCC/Kyoto Protocol
Solar and Terrestrial Radiation • Solar (280-4000 nm) • Direct (total and spectral) (412, 500, 610, 778, 868) • Diffuse • (Global) • UVB (Alice Sp, Cape Grim) • Terrestrial (>4000 nm) • Minute statistics • WAN-based • data distribution (30 min, daily updates) • Quality System
Solar & Terrestrial Network • Solar (280-4000 nm) • Direct (total) spectral 412, 500, 610, 778, 868)(either K&Z CH1 or Middleton DN5/sapphire), body temp. • Direct Spectral SPO2 (368, 412, 500 (x2), 610, 778, 812, 868, 10 nm FWHM) • Diffuse (CM11/CMP21, body temp) • (Global CM11/CMP21, body temp) • UVB (NZ spectrometer, Alice Springs, Darwin) • ASR (Adelaide), UV ASR (Melbourne) • PFR Alice Springs (GAWPFR) • PI Radiometer (UV, 260-480 nm, 0.3 nm pixel) – 5 ready for deployment • Terrestrial / Longwave (>4000 nm) – shaded Eppley PIR • Data acquistion – Datataker 500 -> CS 3000 • 1 Hz sampling (-> storing 1Hz) • Minute signal statistics (mean, max, min, std. devn.) • Sunshine seconds (120 Wm-2, 95 Wm--2, 145 Wm--2) • ftp ‘quick look’ to RIC and intranet every 30 minutes • daily ftp for processing post midnight • cleaning monitor, local statistics for observer
Solar & Terrestrial Calibration Frequency • Regional Radiation Centre • Two Calibration Kits • Agilent data system (yearly) • CH1 pyrheliometer (6 monthly) • FT001/DN5/Huskeflux/CHP1 pyrheliometer (6 monthly) • Eppley PIR (12 monthly) • Station visits (2-5 days) • BSRN (4) – 6 monthly • Standard (6) – 2 years
Field Calibrations – 6 month or 2 years(locations where clear sun can be expected) Pyrheliometer solar sequence ~4 hours clear sun • Instruments connected in parallel to local data system and cal kit data systems • Direct compared to 2 cal kit pyrheliometers of different type(for >90 minutes, 1 Hz sampling, uninterripted sun) • Global and diffuse pyranometers swapped Continuous verification/calibration of pyranometers in situ Sunny sites Total diffuse ratio (in conditions of < 1 Wm-2 direct for > 30 min) Component sum (used for daily verification) Alternate (pyranometer swap) method “Pseudo” method using total diffuse ratio “Haliwell” Scattered cloud method ~ 1 remote year remote sun-disk calibration on clear sky day Cloudy (2) site calibrations “Haliwell” Scattered cloud method to verify pyranometer Instrument rotation of pyrheliometer and pyranometers
Field Calibrations – Infrared & Data System(All Stations) Pyrgeometer • Night comparison only • cloud base > 3 km – variable cloud base is best • >90 minutes comparison post sunset with cal kit pyrgeometer Data system • Verified by parallel voltage and resistance measurements Pyrheliometer and PIR calibration runs are processed just post collection back at HO (Melbourne) ideally same day to determine if the calibration is successful, or needs to be repeated
Bureau Developed Radiometers UV ASRMelbourne Airport PI Radiometer Test Facility