Demand and Supply Applications Chapter 4
Demand and Supply Applications Chapter 4. Chapter 5 Elasticity. The Price System: Rationing and Allocating Resources. Prices perform two major roles in market systems: rationing the available goods and services, and


Demand and Supply Applications Chapter 4
E N D
Presentation Transcript
Demand and Supply Applications Chapter 4 Chapter 5 Elasticity
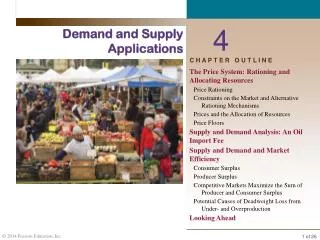
The Price System: Rationing and Allocating Resources • Prices perform two major roles in market systems: • rationing the available goods and services, and • determining which goods and services are produced and how they're produced.
The Price System: • Rationing andAllocating Resources price rationing The process by which the market system allocates goods and services to consumers when quantity demanded exceeds quantity supplied. The Market for Wheat Fires in Russia in the summer of 2010 caused a shift in the world's supply of wheat to theleft, causing the price to increase from $160 per millions of metric tons to $247. The equilibrium moved from C to B.
The Price System: • Rationing andAllocating Resources The adjustment of price is the rationing mechanism in free markets. Price rationing means that whenever there is a need to ration a good—that is, when a shortage exists—in a free market, the price of the good will rise until quantity supplied equals quantity demanded—that is, until the market clears.
Constraints on the Market and Alternative Rationing Mechanisms price ceiling A maximum price that sellers may charge for a good, usually set by government. In 1974, a ceiling price of $0.57 cents per gallon of leaded regular gasoline was imposed. If the price had been set by the interaction of supply and demand instead, it would have increased to approximately $1.50 per gallon. At $0.57 per gallon, the quantity demanded exceeded the quantity supplied. Because the price system was not allowed to function, an alternative rationing system had to be found to distribute the available supply of gasoline.
Non-priceRationing Mechanisms • queuing • Waiting in line as a means of distributing goods and services: • a nonprice rationing mechanism. • black market • A market in which illegal trading takes place at • market-determined prices. • favored customers • Those who receive • special treatment from • dealers during • situations of excess • demand. • ration coupons • Tickets or coupons that entitle individuals to purchase a certain amount of a given product per month.
Prices and the Allocation of Resources • Price changes resulting from shifts of demand in output markets cause profits to rise or fall. • Profits attract capital; losses lead to disinvestment. Higher wages attract labor and encourage workers to acquire skills. At the core of the system, supply, demand, and prices in input and output markets determine the allocation of resources and the ultimate combinations of things produced.
Supply and Demand Analysis: An Oil Import Fee At a world price of $18, domestic production is 7.7 million barrels per day and the total quantity of oil demanded in the United States is 13.6 million barrels per day. The difference is total imports (5.9 million barrels per day). tariff a tax on imported goods If the government levies a 33 1/3 percent tax on imports, the price of a barrel of oil rises to $24. The quantity demanded falls to 12.2 million barrels per day. At the same time, the quantity supplied by domestic producers increases to 9.0 million barrels per day and the quantity imported falls to 3.2 million barrels per day.
Supply and Demand and Market Efficiency consumer surplus The difference between the maximum amount a person is willing to pay for a good and its current market price. producer surplus The differencebetween the current market price and the full cost of production for the firm.
Supply and Demand and Market Efficiency Consumer Surplus As illustrated in Figure (a), some consumers are willing to pay as much as $9.00 each for unit. Since the market price is just $5, they receive a consumer surplus of $4for each unitthat they consume. Others are willing to pay something less than $9and receive a slightly smaller surplus. Since the market price of unitsis just $5, the area of the shaded triangle in Figure (b) is equal to total consumer surplus.
Supply and Demand and Market Efficiency Producer Surplus As illustrated in Figure (a), some producers are willing to produce unitsfor a price of $1each.Since they are paid $5, they earn a producer surplus equal to $4. Other producers are willing to supplyunitsat a price of $2; they receive a producer surplus equal to $3. Since the market price ofunitsis $5, the area of the shaded triangle in Figure (b) is equal to total producer surplus.
Supply and Demand and Market Efficiency Competitive Markets Maximize the Sum of Producer and Consumer Surplus Total Producer and Consumer Surplus Total producer and consumer surplus is greatest where supply and demand curves intersect at equilibrium.
Supply and Demand and Market Efficiency Competitive Markets Maximize the Sum of Producer and Consumer Surplus deadweight loss The net loss of producer and consumer surplus from underproduction or overproduction.
Supply and Demand and Market Efficiency Competitive Markets Maximize the Sum of Producer and Consumer Surplus Deadweight loss from overproduction Deadweight loss from underproduction
Concept of Elasticity • Elasticity is used to describe the behavior of buyers and sellers in the market. • Elasticity • A general concept used to quantify the response in one variable when another variable changes. • Elasticity • is a measure of the quantity demanded or supplied to one of its determinants.
Price Elasticity of Demand • price elasticity of demand • The ratio of the percentage of change in quantity demanded to the percentage of change in price; measures the responsiveness of quantity demanded to changes in price.
Price Elasticity of Demand • Types of Elasticity • if the result is > 1, demand is said to be elastic • if the result is < 1, demand is said to be inelastic • if the result is = 1, demand is said to be unitary elastic • if the result is = 0, demand is said to be perfectly inelastic
Types of Elasticity • Elastic Demand • Quantity demanded responds strongly to changes in price. • Price elasticity of demand is greater than one.
Types of Elasticity • Inelastic Demand • Quantity demanded does not respond strongly to price changes. • Price elasticity of demand is less than one.
Types of Elasticity • Unit Elastic • Quantity demanded changes by the same percentage as the price.
Types of Elasticity • Perfectly Inelastic • Quantity demanded does not respond to price changes.
Types of Elasticity • Perfectly Elastic • Quantity demanded changes infinitely with any change in price.
Slope and Elasticity The value of the slope of thedemand curve and the value of elasticity are not the same. Unlike the value of the slope, the value of elasticity is a useful measure of responsiveness.
Calculating the Price Elasticity of Demand Calculating Percentage Changes To calculate percentage change in price using the initial value as the base, the following formula is used: To calculate percentage change in quantity demanded using the initial value as the base, the following formula is used:
Calculating the Price Elasticity of Demand Calculating Percentage Changes
Calculating the Price Elasticity of Demand Midpoint Formula The midpoint method gives us the same price elasticity of demand between two points regardless of the direction of change.
Effects of price changeson quantity demanded: Elasticity and Total Revenue In any market, P x Q is total revenue (TR) received by producers: When price (P) declines, quantity demanded (QD) increases. The two factors, P and QD move in opposite directions: TR = P x Qtotal revenue = price x quantity
Elasticity and Total Revenue Total revenue is the amount paid by buyers and received by sellers of a good.
Effects of price increase ona product with inelastic demand: Elasticity and Total Revenue Because total revenue is the product of P and Q, whether TR rises or falls in response to a price increase depends on which is bigger: the percentage increase in price or the percentage decrease in quantity demanded. If the percentage decline in quantity demanded following a price increase is larger than the percentage increase in price, total revenue will fall. Effects of price increase ona product with inelastic demand:
How Total Revenue Changes When Price Changes: Inelastic Demand
How Total Revenue Changes When Price Changes: Elastic Demand
effect of price cut on a product with elastic demand: Elasticity and Total Revenue The opposite is true for a price cut. When demand is elastic, a cut in price increases total revenues: When demand is inelastic, a cut in price reduces total revenues: effect of price cut on a product with inelastic demand:
Elasticity and Total Revenue Summary
The Determinants of Demand Elasticity Availability of Substitutes Perhaps the most obvious factor affecting demand elasticity is the availability of substitutes. The Importance of Being Unimportant When an item represents a relatively small part of our total budget, we tend to pay little attention to its price. The Time Dimension The elasticity of demand in the short run may be very different from the elasticity of demand in the long run. In the longer run, demand is likely to become more elastic, or responsive, simply because households make adjustments over time and producers develop substitute goods.
Other Important Elasticities income elasticity of demand A measure of the responsiveness of demand to changes in income. cross-price elasticity of demand A measure of the response of the quantity of one good demanded to a change in the price of another good.
Other Important Elasticities Elasticity Of Supply elasticity of supply A measure of the response of quantity of a good supplied to a change in price of that good. Likely to be positive in output markets. elasticity of labor supply A measure of the response of labor supplied to a change in the price of labor.