Download
1 / 10
100 likes | 235 Vues
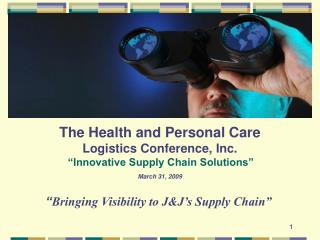
The Health and Personal Care Logistics Conference, Inc. “Innovative Supply Chain Solutions” March 31, 2009. “ Bringing Visibility to J&J’s Supply Chain”. 1. Where is value derived from improved supply chain visibility?. Lower stock-outs Lower discounting Lower penalties and expenses.

E N D
The Health and Personal CareLogistics Conference, Inc.“Innovative Supply Chain Solutions”March 31, 2009 “Bringing Visibility to J&J’s Supply Chain” 1
Where is value derived from improved supply chain visibility? • Lower stock-outs • Lower discounting • Lower penalties and expenses Increased Revenue Growth Reduced Inventory Reduced Transportation Expense Reduced Distribution Expense Areas of potential value • Lower safety and cycle stock • Improved demand management • Improved visibility to inbound inventory “Pull vs Push” • Improved load/asset utilization • Improved transit times • Reduced expedited shipments • Improved procurement activities • Labor planning and scheduling • Reduced compliance costs • Reduced customs clearance issues • Improved asset utilization
Sample Opportunity Analysis: Summary of shipment transit time and variability Observation: Top (3) countries with greatest shipment volume exceed 10 day transit time 15% of the time, and account for 65% of “delayed” shipments 3
Supply Chain Visibility What is it? Actionable Visibility to In-Transit Shipment Management • Web based data repository where supply chain network stakeholders (e.g., inventory/production planners, distribution managers, etc.) can monitor in-transit shipments • Near real-time access to information enables more flexible inventory management and proactive responses to dynamic market changes • Alerts and key milestone event management to mitigate potential transit delays • Single portal source for transportation service provider performance tracking, metric management and reporting • Compliance risk mitigation via on-line information tools for stakeholders responsible for regulatory management activities
Supply Chain Visibility Solution Region 1 Manufacturing Region 2 Distribution Shipping Status/Customs Status/Port Status/FDA Status Compliance Product Protection 4PL Air/Ocean Sourcing Transit Time Optimization Shipment Status/Alerts ASPAC Planning LATAM Planning EMEA Planning NA Planning
ELP-AMS PROCESS FLOW Airline:Continental Routing:ELP-IAH-AMS , Airline: British Airways Routing:ELP-IAH-LHR-AMS & ELP-IAH-LGM-AMS Airline: Singapore Routing: ELP-DFW-AMS Back up Airlines: AA, KLM, Northwest Routing: ELP-DFW-AMS Shipper drops off at EI location. TSF- when we give it to our trucker to take it to airline in IAH, except when using BA as they pick up as part of their rate. Small shipments get consolidated to DFW outside 5 day program (under 200kg) Measurements: FRD-COB=1, COB-AFD=3.5. AFD-RLS=1 TOTAL=5.5 AIR TRUCK TRUCK FRD Origin IAH-AMS CONTINENTAL ELP-IAH LHR-AMS IAH-LHR British Airways ELP-IAH British Airways ELP-IAH LGW-AMS IAH-LGW TSF Singapore ELP-DFW DFW-AMS TNF AFD ENF RLS DLV Destination
Pilot Lane – El Paso to Amsterdam ELP to AMS Lane: April 2008 Through October 2008 ORIGINAL VIEW
Pilot Lane – El Paso to Amsterdam ELP to AMS Lane: October 2008 Nov 2008 VIEW
Supply Chain Visibility Solution Benefits • Near Real Time Freight Lane Management • Performance Metrics • Reduced variability for actual transit times versus planned transits • Improved inventory management and related savings • Enhanced transportation service providers performance and track and trace capability • Optimized ports of entry • Global Compliance Risk Mitigation • Centralized Data Repository for Cross Sector Opportunity Analysis • Actionable Incident Reporting
Challenges and Opportunities • Logistics providers technology capabilities vary • Direct data extraction for most providers is not a simple process • Leverage continued business relationship as the driver for participation and compliance THANK YOU!! QUESTIONS??