Supply chain and logistic optimization
Supply chain and logistic optimization. Road Map. Definition and concept of supply chain. Primary tool box at strategic level (software). Models at strategic level. Models at tactical level. Potential of SCM. A box of cereal spends, on average, more than 100 days from factory to sale.

Supply chain and logistic optimization
E N D
Presentation Transcript
Road Map • Definition and concept of supply chain. • Primary tool box at strategic level (software). • Models at strategic level. • Models at tactical level.
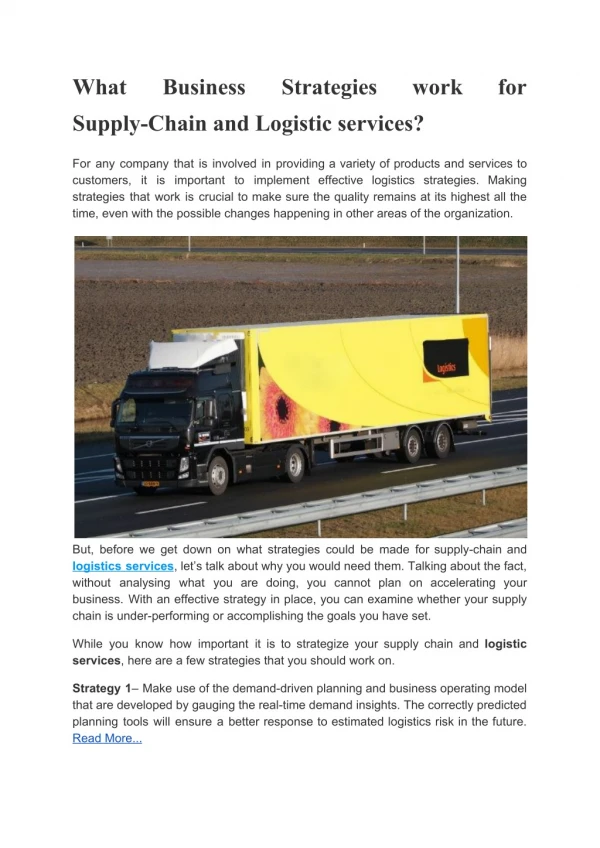
Potential of SCM • A box of cereal spends, on average, more than 100 days from factory to sale. - A car spend around 2 weeks from factory to dealer. • National Semiconductor (USA)used air transportation and closed 6 warehouses, 34% increase in sales and 47% decrease in delivery lead time.
Compaqestimates it lost $0.5 billion to $1 billion in sales in 1995 because laptops were not available when and where needed. • When the 1 gig processor was introduced by AMD (Advanced Micro Devices), the price of the 800 meg processor dropped by 30%. • P&Gestimates it saved retail customers $65 million (in 18 months) by collaboration resulting in a better match of supply and demand.
IBM claims that it lost a major market share for desktops in 93, for not been able to purchase enough of a display chip. • US companies spent $898 B for SC activities in 98. Out of the above 58% of SC costs were incurred for transportation and 38% for inventory.
Advantage of low inventories • Less time in storage– less deteriorate-High quality. • Effective distribution process (Fast delivery to customers) • Switching from old technology to new technology without scraping lot of products. • Of course less storage cost.
Gartner Group: “By 2004 90% of enterprises that fail to apply supply-chain management technology and processes to increase their agility will lose their status as preferred suppliers”. AMR Research: “The biggest issue enterprises face today is intelligent visibility of their supply chains – both upstream and down”
Why supply chain: A tutorial Supplier Retailer Demand Retailer
Traditionalscenario Demand (Q)= A - B*Z Assume A = 120 B = 2 Supplier buys a goods at price X Sells to retailer at a price Y Retailer sells to customer at a price Z Retailers profit (R) = (Z-Y) * (A-B*Z)
Combined profit CP=0.25 (A2 / B -2 . A .X + 2 . B. X. Y – B. Y2)
Summery Traditional scenario Demand 20 units Retail price $ 50.0 Retailer’s profit $ 200.0 Supplier’s profit $ 200.0 Collaborative scenario Demand 30 units Retail price $ 45.0 Retailer’s profit $ 225.0 Supplier’s profit $ 225.0
10000 Demand P=2000-0.22Q 2000 Price Example • A Retailer and a manufacturer. • Retailer faces customer demand. • Retailer orders from manufacturer. Demand Curve Variable Production Cost=$200 Selling Price=? Manufacturer Retailer Wholesale Price=$900
Example • Retailer profit=(PR-PM)(1/0.22)(2,000 - PR) • Manufacturer profit=(PM-CM) (1/0.22)(2,000 - PR) Retailer takes PM=$900 Sets PR=$1450 to maximize (PR -900) (1/0.22)(2,000 - PR) Q = (1/0.22)(2,000 – 1,450) = 2,500 units Retailer Profit = (1,450-900)∙2,500 = $1,375,000 • Manufacturer takes CM=variable cost Manufacturer profit=(900-200)∙2,500 = $1,750,000
Example: Discount • Case with $100 discount New demand Q = (1/0.22) [2,000 – (PR-Discount)] = (1/0.22) [2,000 – (1450-100)] = 2954 Retailer Profit = (1,450-900)∙2,955 = $1,625,250 Manufacturer profit=(900-200-100)∙2,955 = $1,773,000
Wholesale discount • $100 wholesale discount to retailer • Retailer takes PM=$800 Sets PR=$1400 to maximize (PR -800) (1/0.22)(2,000 - PR) Q = (1/0.22)(2,000 – 1,400) = 2,727 units Retailer Profit = (1,400-800)∙2,727 = $1,499,850 • Manufacturer takes PR=$800 and CM=variable cost • Manufacturer profit=(800-200)∙2,727 = $1,499,850
Global Optimization • What happens if both collaborate (SCM)? Manufacturer sets PR=$1,100 to maximize (PM -200) (1/0.22)(2,000 - PM) Q = (1/0.22)(2,000 – 1,100) = 4,091 units Net profit =(1100-200)∙ 4,091 = $3,681,900
Market Requirement • Low price. • High quality. • Product customization. • Fast delivery. • Fast technology induction. Strategy: Right product + Right quantity + Right customer + Right time Cost reduction and value addition at each stage
Sharing information will lead to reducing uncertainty for all the partners and hence: - reducing safety stocks, - reducing lead times, - improving brand name. Result - Value added product/services - large market segment (Leading brand), - long lasting supply chain, - consistent and growing profits, - Satisfied customer. It is better to collaborate and co-ordinate to achieve a win-win situation.
Definition Supply Chain refers to the distribution channel of a product, from its sourcing, to its delivery to the end consumer. (some time referred as the value chain) A supply chain is a global network of organization that cooperate to improve the flows of material and information between suppliers and customers at the lowest cost and the highest speed. Objective is customer satisfaction and to get competency over others
Supply chain Information flow Material Flow Cooperation Value addition
Customer satisfaction Cost Value added product Operational performance Coordination Information sharing Assets Management (Inventory)
Difficulties • Increasing product variety. • Shrinking product life cycle. • Fragmentation of supply chain. • Soaring randomness because of new comers.
Responsiveness (High cost) Zone of strategic fit Low cost Deterministic Uncertainty
FMCG (Tooth paste, soaps etc ) Price sensitive, Low uncertainty Fashionable products (Garments), customize products etc High responsiveness, high uncertainty
Ineffective marketing Wrong material High Inventories Low order fill rates Supply shortages Inefficient logistics High stock outs
Local objectives vs Global objective • Production • - Low production cost. • High utilization. • High quality raw material. • Big order size. • Stable production. • Short delivery lead times (Raw materials) • Marketing • - High inventories levels. • Low prices. • Ability to accept every customer order. • Short product delivery lead times. • Various order sizes and product mixes. SCM is a tool which integrate necessary activities and decomposing irrelevant activities.
Management by departments Management by projects Finished products Orders
Primary decisions Secondary decisions Buy Sell Make Move Store
Recruitment of employees Salary, TA, DA Training, relocation, etc
Strategic models Selection of providers • Provider provides the quantity between two limits. • Cost is a concave function of the shipped quantity. • Objective is to select one or more provider to satisfy the demand. • Case of single manufacturing unit. • Case of several manufacturing unit.
Cost function Problem to be solved
Algorithm • Select the cheapest provider if the quantity to be supplied is maximum. • Adjust the remaining quantity among rest of the providers so that the solution remain feasible.
Exact algorithm for the integer demand • Compute the cost for the first provider for q=1,2,…A. • For provider=2,…N - Compute the Q=1,2,…,A F(Pro,Q)=Min0<=x<=Q (F(Pro-1, Q-x), fpro(x)
Approches • Heuristic approach. • Piece wise linearization for integer programming. • Bender decomposition.
Capacity Planning Providers Retailers Manufacturers
Idle processing capacity with providers in different periods. • Idle transportation capacity with providers in different periods. • Idle manufacturing capacity with manufacturers. • Idle transportation capacity with manufacturers. • Demand at various retailers and the demand of one period may differ from another period. Objective is to decide how much and where to invest.
Supply <= Available Capacity + Added Capacity Added capacity <= BigNumber* Binary Variable {0,1} Investment Cost BinaryVariable*FixedCost + Slope*Added capacity
Results • There exist at least one optimal solution in which all the binary constraints are saturated. • Replacing big number by corresponding capacity, if greater than zero, and denote new problem by P2m, then m is definite.