Download
1 / 58
710 likes | 1.56k Vues
Physiology of the Cardiovascular System. Chapter 19. Heart’s Role in Maintaining Homeostatis. Circulation (pumping action) varies based on needs of the body Hemodynamics - Describes a collection of mechanisms that influence the active and changing circulation of blood throughout the body

E N D
Physiology of the Cardiovascular System Chapter 19
Heart’s Role in Maintaining Homeostatis • Circulation (pumping action) varies based on needs of the body • Hemodynamics - Describes a collection of mechanisms that influence the active and changing circulation of blood throughout the body • Increase activity = increased blood flow
Heart as a Pump • 4 Chambers of the heart create two pumps • Right side pulmonary circulation • Left side systemic circulation
Conduction System of the Heart • 4 structures composed of specialized cardiac muscle make up the conduction system of the heart: • SA Node, AV Node, AV bundle (Bundle of His), Purkinje Fibers • Non contractile • Permit generation or rapid conduction of an action potential
SA Node • Pacemaker of the heart • R atrium at base of superior vena cava • Specialized cells within the node produce an intrinsic rhythm • Produce impulses without stimulation from any other body system • Fires or discharges 70-75 times/minutes
Conduction Route Impulse generated in SA node interatrial bundle allows conduction of impulse to L atrium internodal bundles carry impulse to AV node **conduction slows through AV node to allow complete contraction of atria** Conduction increases after passing though AV node R/L branches of AV bundle purkinje fibers ventricular muscles simultaneous ventricular contraction
Conduction Route • Ectopic pacemakers • If SA node loses ability to generate impulses, the AV node or Purkinje fibers will take over • HR will be slower
Artificial Pacemakers • Surgically inserted device which stimulates the heart at a set rhythm • Stimulate a set rhythm or fire when HR drops below a set minimum • Transvenous approach • Incision above R clavicle • Electrode threaded into jugular vein • Advanced to apex of R ventricle • Power pack is attached to subcutaneous tissue
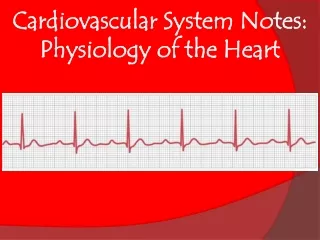
Electrocardiogram (ECG) • Conduction through the heart creates electrical currents that spread to the surface of the body • ECG is a graphic record of the electrical activity of the heart • Electrodes of a electrocardiograph attached to a person’s skin can record changes in the heart’s electrical activity • Observed as deflections
Cardiac muscle @ rest – no difference in charge btwn electrodes Action potential reaches first electrode. External surface becomes relatively negative. Upward deflection on ECG. AP reaches 2nd electrode. No difference in charge. Deflection returns to zero. End of AP reaches the 1st electrode. Sarcolemma is slightly positive creating a downward deflection. End of AP reaches the 2nd electrode. No difference in charges. Deflection returns to zero.
Summary • Depolarization – deflection representing cardiac muscle moving away from resting membrane potential • Repolarization – deflection in the opposite direction; cardiac muscle moving back towards resting membrane potential
Analyzing ECGs • Series of deflection waves and intervals • Represents net change in polarity • Ex: ventricles are depolarizing while atria are repolarizing
Analyzing ECGs • P wave • Depolarization of the atria • Electrical impulse passes from SA node to R/L atria • QRS complex • Depolarization of the ventricles • Repolarization of the atria • Voltage fluctuation overshadowed by the depolarization of the ventricles • First to depolarize, first to repolarize
Analyzing ECGs • T wave • Repolarization of the ventricles • First to depolarize, last to repolarize **ECG is a record of the electrical activity of the heart, NOT of the heart’s contraction. Contraction occurs after depolarization**
Cardiac Dysrhythmias • Abnormal rhythm of the heart • Heart Block • Conducted blocked after AV node • Ventricles contract slowly • Wide spaces between P waves and QRS complex • Complete Heart Block – multiple P wave per QRS complex
Cardiac Dysrhythmias • Bradycardia • Slow HR (< 60bpm) • ECG will show spread out waves • Causes: • Damaged SA node • Abnormal autonomic nervous control • Tachycardia • Increased HR (>100bpm) • ECG will show condensed waves • Causes: • Abnormal autonomic nervous control • Blood loss/shock • Drugs • Fever
Cardiac Dysrhythmias • Atrial fibrillation (“A-fib”) • Premature contractions • Absence of P waves • Chambers do not pump efficiently • Treated with digoxin (digitalis) or defibrilation • Causes: • Mitral stenosis • Rheumatic heart disease • Myocardial infarction
Cardiac Dysrhythmias • Ventricular fibrillation (“v-fib”) • Ventricular contraction/pumping stops • Life threatening situation • Treated with defibrillation
Cardiac Cycle • One complete heart beat • Consists of one contraction (systole) and one relaxation (diastole) of both the atria and ventricles • Atria contract simultaneously • Ventricles contract; atria relax • Ventricles relax; atria remain relaxed
Atrial Systole • Atria contracted • AV valves open • Ventricles filling with blood • Semilunar valves closed • Begins with P wave of the ECG
Isometric Ventricular Contraction • “having the same measured volume” • Time between ventricular systole and opening of SL valves • Volume is constant; pressure increases • Ventricular systole coincides with the R wave & the first heart sound
Ejection • Ejection occurs when pressure in the ventricles exceeds pulmonary artery & aorta • Rapid ejection – initial, shorter phase • Reduced ejection – coincides with T wave • Residual volume – blood that remains in the ventricles after ejection • Increases in ppl with heart failure • Ejection fraction
Isovolumetric Ventricular Relaxation • Begins with ventricular diastole • SL valves close; AV valves remain closed • Volume is constant; pressure decreases • Second heart sound
Passive Ventricular Filling • Atria filling increases intraatrial pressure • AV valves are forced open
Heart Sounds • “Lubb-Dubb” • “Lubb” – systolic sound • contraction of the ventricules and closing of the AV valves • Longer, lower • “Dubb” – diastolic sound • Closure of the SL valves • Shorter, sharper • Heart murmur – abnormal heart sounds • Incomplete closing of the valves • Valvular insufficiency or stenosis
Arterial Blood Pressure • Maintaining arterial pressure is necessary to maintain circulation • Arterial blood pressure is directly proportional to arterial blood volume • Cardiac output and peripheral resistance influence arterial volume
Cardiac Output • Stroke volume x Heart Rate = Cardiac output (SV x HR = CO) • Stroke volume: volume of blood pumped out of the ventricles by each heart beat • Increase speed or strength of contraction = increase arterial volume = increase arterial pressure
Factors Affecting Stroke Volume • Starling’s Law of the Heart • Longer muscle fibers prior to contraction = stronger contraction • Increased blood return to the heart per minute = longer muscle fibers
Factors Affecting Heart Rate • Aortic baroreceptors and carotid barorecetors are located near the heart and are sensitive to changes in pressure • Carry sensory information to cardiac center in medulla oblongata • If HR above a set point, a signal is sent to the SA node via efferent parasympathetic pathways of the vagal nerve • Achtylcholine is released to decrease firing of SA node • Negative feedback loop
Factors Affecting Heart Rate • Sympathetic nervous system can increase heart rate • Release of epinephrine and norepinephrine • Exercise, fight or flight response, pain, fever
Peripheral Resistance • Resistance to blood flow due to friction between blood and arterial walls • Friction due to: • 1) viscosity • Red blood cell count • Blood protein concentration • 2) diameter of arterioles and capillaries • “arteriole runoff” = amount of blood that runs out of the arteries into the arterioles • Greater resistance = less runoff = increased blood volume in arteries = increased arterial pressure
Peripheral Resistance • Aortic and carotid baroreceptors also exhibit vasomotor control • Increase in arterial pressure inhibits vasoconstrictor center in medulla oblongata • Impulses sent via parasympathetic fibers to slow HR and dilate arterioles • Decrease in arterial pressure stimulates vasoconstrictor center in medulla oblongata • Impulses send via sympathetic fibers to increase vasoconstriction
Venous Return to the Heart • Venous Pumps • Inspiration increases pressure gradient between peripheral and central veins (vena cava) • Contraction of the diaphragm increases thoracic cavity therefore decreasing pressure within those blood vessels (vena cava and atria)
Venous Return to the Heart • Venous pumps • Skeletal muscle contractions squeeze surrounding veins and help “milk” blood back to heart
Venous Return to the Heart • Total Blood Volume • Increase blood volume = increased blood return to the heart • Capillary Exchange: exchange of material between plasma and interstitial fluid in tissues • Osmotic and hydrostatic pressure create inward and outward directed forces at arterial and venous ends • No net loss of blood volume • Fig 19-18, page 614
Venous Return to the Heart • Changes in Total Blood Volume • Antidiuretic Hormone (ADH) • Secreted from posterior pituitary • Increases water absorption in kidneys • Increase water absorption = increase blood plasma volume • Renin-angiotensin mechanism • Renin is secreted from kidneys when blood pressure is low • Triggers series of events leading to secretion of aldosterone from adrenal glands • Aldosterone causes sodium retention in kidneys; water follows Na+ = blood volume increases
Venous Return to the Heart • Changes in Total Blood Volume • ANH mechanism (atrial natriuretic hormone) • Released from cells of the atrial wall in response to overstretching (abnormally high venous return) • Increases sodium loss in urine; water follows
Measuring Arterial Blood Pressure • Measured using a sphygmomanometer • Measured in mmHg • How high (in mm) air pressure raises a column of mercury (Hg) • Procedure: • Cuff wrapped around brachial artery (upper arm) • Pump cuff full of air until the air pressure exceeds blood pressure (compresses the artery)
Measuring Arterial Blood Pressure • Place stethoscope of brachial artery at bend of elbow • Slowly release air from cuff and listen for Korotkoff sounds • First sound will be heard when air pressure = blood pressure Systolic Blood Pressure • Force against arterial wall when ventricles are contracting • Second sound Diastolic Blood Pressure • Force against arterial wall when ventricles are relaxed