AVIATION 120
Today's Agenda. Atmospheric Pressure and Air CirculationStudy and Reference MaterialAtmospheric PressureWhat it isRelationship with temperature

AVIATION 120
E N D
Presentation Transcript
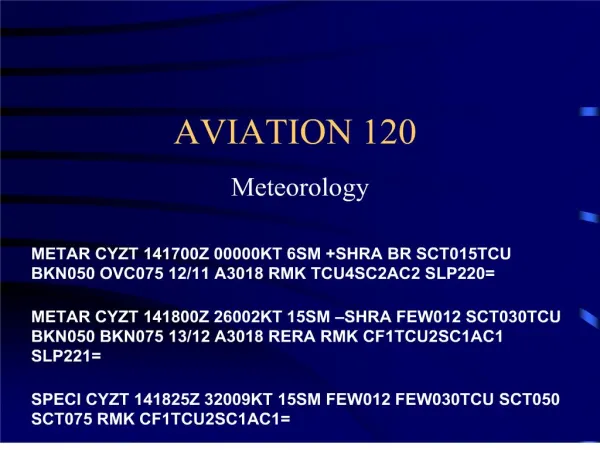
1. AVIATION 120 Meteorology
2. Today�s Agenda Atmospheric Pressure and Air Circulation
Study and Reference Material
Atmospheric Pressure
What it is
Relationship with temperature � The Gas Law
How it varies with place and time
How it is measured
Sea Level Pressure vs. Station Pressure
Surface weather charts � isobars
Upper Level weather charts � contours
Pressure Features - Ridges, Troughs, Highs and Lows
3. Atmospheric Pressure Atmospheric pressure is also known as:
Air Pressure
Barometric Pressure
Atmospheric pressure is the mass of air above sea level, ground level, or any other level
Units of pressure can be expressed as:
Millibars (mb)
Hectopascals (hPa)
Pascals (Pa)
Inches of Mercury (in. Hg)
Millimeters of Mercury (mm Hg)
Pounds per Square Inch (PSI or lb/in.2)
Refer to Meteorology Today, Appendix A for conversions:
1 mb = 1 hPa = 100 Pa = 0.02953 in. Hg = 0.75 mm Hg = 0.01450 PSI
5. Air Pressure, Density and Temperature The relationship between atmospheric pressure, air density and temperature is described by the gas law or equation of state (see the FOCUS section on pg. 196 in M.T.):
The gas law states that the pressure of a gas is equal to its temperature times its density times a constant
In other words, p = T � ? � Constant, where p is pressure in mb, T is temperature in �K and ? (rho) is density in kg/m3
For our purposes, we can simplify the gas law to the following: p ~ T � ? where �~� means �proportional to�
So, if we keep temperature constant and pressure increases, density must also increase
If we keep pressure constant and temperature increases, density must decrease
It is evident that small changes in temperature or density will bring about a change in atmospheric pressure
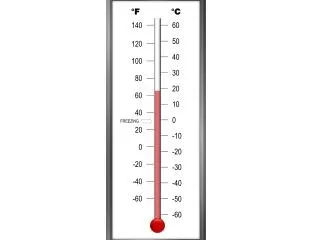
8. Measuring Atmospheric Pressure Atmospheric Pressure is measured with a device called a barometer (hence the term barometric pressure)
Barometers can be one of two varieties:
Mercury barometer
Aneroid barometer
Aircraft altimeters
Barographs
Barometers are subject to the following errors:
Temperature (mercury barometer)
Gravity
Instrument Error
10. Station Pressure vs. Sea Level Pressure Station Pressure
The pressure at a particular location after barometer errors are corrected
This pressure is NOT corrected for the elevation above sea level of the station
This pressure is not very useful due to the difficulty comparing it to other places which may not be at the same altitude
Sea Level Pressure
Sea level pressure is the station pressure adjusted to an altitude of zero which is mean sea level
The correction for altitude is about 10 mb per 100 m but is not constant, it varies with temperature and density
Since sea level pressure of a station is adjusted to an altitude of zero, this is the pressure used to compare atmospheric pressures between different locations
The sea level pressure is the pressure depicted on surface weather maps with isobars
Altimeter settings are MSL pressure corrected using the standard atmosphere.
11. Station Pressure vs. Sea Level Pressure
12. Surface Weather Charts As you have already learned, surface weather charts depict atmospheric pressure as mean sea level pressure
This pressure is depicted with isobars and are smoothed by computers to eliminate mean sea level pressure conversion errors
Other information depicted on surface charts may include:
Temperature
Wind
Sky condition and clouds
Pressure trend
Visibility
Dew point temperature
Surface charts are constant height charts � the constant height is mean sea level
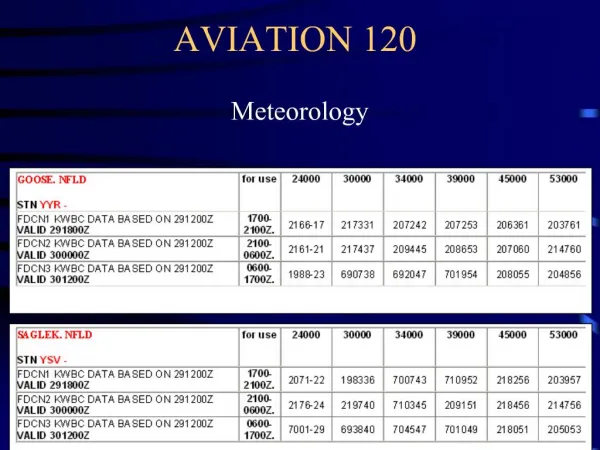
13. Upper Level Weather Charts Upper Level charts are known as constant pressure charts or isobaric charts
These charts depict how a particular pressure level changes height from place to place
These charts use height contours as opposed to the isobars used on surface charts
Examples of constant pressure or isobaric charts:
250 hPa
500 hPa
700 hPa
850 hPa
14. Upper Level Weather Charts
15. Upper Level Weather Charts
16. Upper Level Weather Charts
18. Constant Pressure Surfaces Not only are upper air weather charts depicting a constant pressure surface, but the altimeter in your aircraft is as well
Beware flying from high to low� your aircraft will be closer to the ground than you think if you don�t change the altimeter setting
�When flying from high to low, look out below�
19. Pressure Features - Highs High pressure regions are areas where mean sea level pressure is relatively high when compared to surrounding sea level pressures
High pressure regions normally correspond to warm temperatures aloft, divergence, descending air and fair weather
Surface winds in the northern hemisphere circulate clockwise and outward from surface highs, known as anticyclonic flow
Highs are known as anticyclones
20. Pressure Features - Lows Low pressure regions are areas where mean sea level pressure is relatively low when compared to surrounding sea level pressures
Low pressure regions normally correspond to cold temperatures aloft, convergence, rising air and poor weather
Surface winds in the northern hemisphere circulate counterclockwise and into surface lows, known as cyclonic flow
Mid-latitude storms, cyclones, typhoons, hurricanes and tornados are all low pressure phenomena
21. Highs and Lows - Circulation
22. Pressure Features � Ridges and Troughs A ridge is an elongated area of high pressure
Weather features and circulation associated with a ridge are similar to those associated with a high
A trough is an elongated area of low pressure
Weather features and circulation associated with a trough are similar to those associated with a low
Ridges, troughs, highs and lows can occur both at the surface of the earth as well as at upper levels in the atmosphere
23. Ridges and Troughs - Circulation