Download
1 / 28
280 likes | 388 Vues
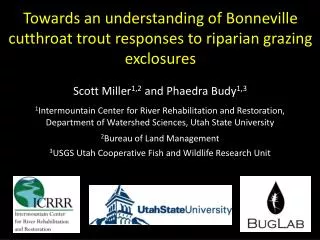
Towards an understanding of Bonneville cutthroat trout responses to riparian grazing exclosures . Scott Miller 1,2 and Phaedra Budy 1,3 1 Intermountain Center for River Rehabilitation and Restoration, Department of Watershed Sciences, Utah State University 2 Bureau of Land Management

E N D
Towards an understanding of Bonneville cutthroat trout responses to riparian grazing exclosures Scott Miller1,2 and Phaedra Budy1,3 1Intermountain Center for River Rehabilitation and Restoration, Department of Watershed Sciences, Utah State University 2Bureau of Land Management 3USGS Utah Cooperative Fish and Wildlife Research Unit
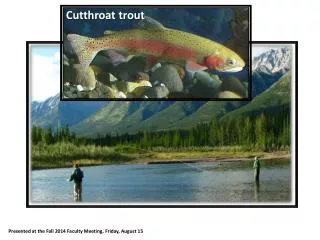
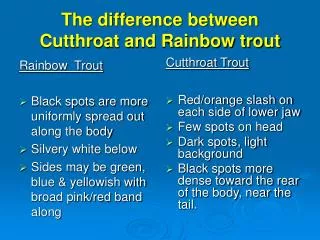
Introduction Habitat Degradation Invasive Species Disease Bonneville cutthroat trout (BCT)
Introduction • Livestock grazing is leading cause of riparian and instream habitat degradation in western U.S. • > 80% of western riparian areas affected
Introduction Grazing Habitat Degradation Invasive Species Disease Bonneville cutthroat trout (BCT)
Introduction • Riparian grazing exclosures widely implemented on public lands • UT public lands: > 150 riparian exclosures • Goals: Restore degraded habitat and facilitate the coexistence of grazing and native fish populations Source: ICRRR Restoration Database
Introduction • Despite widespread implementation, few studies assess restoration efficacy • Cutthroat: Equivocal or conflicting results • What factors contribute to differential responses among system?
Introduction Grazing (-) Riparian vegetative cover/biomass (-) Terrestrial arthropod inputs (-) Salmonid biomass Saunders and Fausch 2007
Introduction Questions: Do BCT populations differ between grazed and ungrazed reaches? What reach-scale factors are related to differences in BCT populations between grazed and ungrazed reaches? Do recovery patterns vary as a function of grazing regime, exclosure age, or exclosure size?
Site selection • 10 paired grazed and ungrazed reaches • BCT • 2nd & 3rd order reaches • Maintained exclosure • Active grazing • Minimize geomorphic differences between pairs • System characteristics • Grazing regime: season long vs. rotational • Age: 4 – 39 years • Size: 0.06 – 96%
Sampling Paired study design Upstream: Grazed Downstream: Ungrazed Min. 1 km buffer • Reach lengths: 20x bankfull • Sampled once: summer 2008 or 2009
Response variables • Fish assemblages • 3-pass depletion • Reaches: 20x bankfull • Response variables: Density, biomass, condition, composition • Diet • Stomach contents - gastric lavage • Stable isotopes (δ13C and δ15N)
Response variables • Physical habitat measurements: Continuous Undercut banks Overhanging vegetation Habitat units (e.g., riffle, run, pool)
Response variables • Physical habitat measurements: Continuous Undercut banks Overhanging veg. Habitat units (e.g., riffle, run, pool) Point Depth Velocity Substrate Temperature* Width
Response variables • Prey availability • Terrestrial arthropod prey • 5 pan traps/reach • 48 hours • Aerial aquatic insects • 5 pan traps/reach • 48 hours • Benthic aquatic arthropod prey • 8 composite Surbers/reach
Results Do BCT populations differ between grazed and ungrazed reaches? NA NA Response Variable % change = 100* ((Ungrazed-Grazed)/Grazed) Statistical Test Wilcoxon signed rank test NA NA
Results W+= 34.0, P = 0.030, df =8 • On average, density and biomass significantly greater within exclosures • Consistent directional changes, while magnitude of change highly variable • No differences in condition, age structure, or assemblage composition NA NA W+= 33.0, P = 0.042, df =8 NA NA
Results What reach-scale factors are related to differences in BCT populations between grazed and ungrazed reaches?
Results R2 = 0.53 BCT biomass responses proportional to increases in terrestrial prey availability R2 = 0.41 BCT density responses scaled with increases in cover availability
Results • Terrestrial prey comprised only 11% of prey availability by biomass • BCT foraging behavior: strong preference of terrestrial prey • 50% of ingested prey
Results Do recovery patterns vary as a function of grazing regime, exclosure age, or exclosure size?
Results Weak relationships with age… 1978 (SDR) 1978 (SL) Grazed Overriding influence of grazing practices Ungrazed
Results Differential responses between grazing regimes and among abiotic and biotic variables Grazed: SL Ungrazed: SL
Results Differential responses between grazing regimes and among abiotic and biotic variables Grazed: SDR Ungrazed: SDR
Results Passive restoration bang for your buck: BCT responses 560% *% Change relative to Grazed - SL 312% 95%
Results Putting responses in a regional context Median population level
Take home points • Variable fish responses to grazing management are likely predictable • Both habitat and prey resource availability (terrestrials) likely facilitate BCT recovery • Grazing management at larger spatial scales will greatly increase efficacy of passive restoration efforts • Landscape versus local-scale processes in facilitating abiotic and biotic recovery trajectories
Future questions • What factors control the recovery of terrestrial arthropod assemblages • Do exclosures facilitate increased growth and survival = source populations • Identify interactions among grazing regime, exclosure age, and size • How robust are these patterns
Acknowledgements • Funding • UDWR Endangered Species Mitigation Fund (# 0809) • Intermountain Center for River Rehabilitation and Restoration • Bureau of Land Management • Field and lab assistance • Paul Mason, Gary Thiede, Reed Chaston, Dave Fowler, Katrina Langenderfer, Ben Marett, Ellen Wakeley, and Hilary Whitcomb • Logistics and permitting • Wyoming Game and Fish Department, Idaho Fish and Game, Utah Department of Wildlife Resources