Download
1 / 15
150 likes | 300 Vues
Using Population Data to Address the Human Dimensions of Population Change. D.M. Mageean and J.G. Bartlett Jessica Daniel 10/27/2009. Background. Interactions between population and the environment are critical to understand;

E N D
Using Population Data to Address the Human Dimensions of Population Change D.M. Mageean and J.G. Bartlett Jessica Daniel 10/27/2009
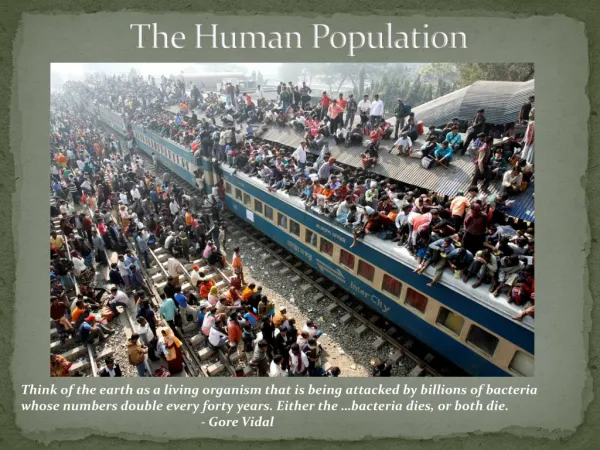
Background • Interactions between population and the environment are critical to understand; • These interactions are relevant to ecology, economic development and human welfare • Population has influences on environment: • global warming, ozone levels, deforestation, biodiversity, pollution
Problem • Gaps in the knowledge about how demographic characteristics affect the environment • Factors to consider include: population size, growth rate, settlement patterns • Many scientific disciplines = difficulty with generating a holistic view of issue
Problem Continued • Need for science that focuses on human- environment interactions (Stern) • Human causes of environmental change, effects of change on things humans value, feedback between humanity and environment • Need to understand dynamic interaction between population: growth & migration (Hogan) • Driving forces in global environmental change
U.S Case Study • Developing countries often studied • U.S.= modeling opportunities: • Projected growth rate and predicted environmental consequences • Growth patterns: regional variability • Highly mobile population; fast growth rates in certain regions • Shifts in population- from NE to SW • Growth in areas subject to environmental stress
U.S. Case Study • 2 questions: • How to utilize data to increase understanding of human dimensions of land use? • How compatible are data sets with current environmental data sets? • Case study integrates various data sets • Utilize methodological & conceptual methods • Integrate remote sensing with environmental & human data
Methods • 640 km2 hexagon –unit of analysis • Derived from EPA’s EMAP • 12,600 hexagons digital overlay onto U.S. • Hexagons used because distance between centroids of 2 adjacent hexagons was 27km • AVHRR meteorological satellite images • Landscape and habitat data; land cover classification
Methods: Land Cover Classifications • 159 land cover classes > 13 classes (Anderson Level II) + urban class = • 14 land cover types • ex: cropland/pasture, rangeland, deciduous forests, water, alpine tundra, urban areas • Characteristics calculated for each hexagon; landscape pattern metrics • Ex: Edge frequency & classes, road abundance, shape complexity, etc. . .
Case Study • One goal was to determine extent that population density represented the most human- environment interaction • 9 Variables: • From 1990 U.S. Census- county level data • Could be linked to land use/ cover pattern variation • Variables were examined with PCA (principle components analysis) • Variables were weighted, each hexagon’s variable was calculated from intersected coverage areas
Results • PCA: used to create composite indices of human effects • 2 indices of interests • Human settlement (PC 1) • Independent growth & settlement (PC 2) • Couldn’t use traditional linear regression • Used an adaptive statistical technique to identify relationships between land use and climate • CART (classification and regression tree)
CART • CART: • Splits focal variables (what want to study) with respect to independent variables • Based on the threshold, data splits off the original variable • Ovals = splitting points at variables • Rectangles = stopping points • Continues splitting until desired criterion is reached
Results Continued • 2 general conclusions • Urban centers primarily in East • Wetter, proximity to ocean, historical factors • Interactions between climate variables influenced settlement patterns • Summer temperatures (east), annual temperature variations (west) • Study identified interactions rather than correlations between settlement and environment