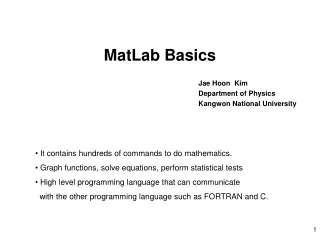
Appendix A MATLAB Basics
This guide covers MATLAB basics, including variable declaration, matrix operations, and plotting functions for beginners. Learn how to utilize semicolons, control output format, and create graphs using built-in functions.

Appendix A MATLAB Basics
E N D
Presentation Transcript
Figure A.10 Output format control illustrates the four forms of output.
Figure A.12 Complex and real matrix input with automatic dimension and type adjustment.
Figure A.13 Three basic matric operations: addition, multiplication, and transpose.
Figure A.18 (a) MATLAB commands. (b) A basic x-y plot of x sin(x) versus x.
Figure A.19 (a) MATLAB commands. (b) A basic x-y plot with multiple lines.
Figure A.20 Using subplot to create a 2 X 2 partition of the graph display.
Figure A.21 A simple script to plot the function y(t) - sin t.
Figure A.23 An interactive session using a script to plot the function y(t) - sin t.