Download
1 / 25
260 likes | 460 Vues
The Economics of Alternative Energy Sources and Globalization: The Road Ahead. Orlando, FL, Nov. 15. Is grain sorghum an alternative for ethanol production?. Teresa Duch-Carvallo | Jaime Malaga. Texas Tech University. OUTLINE. BACKGROUND OBJECTIVES EQUATIONS

E N D
The Economics of Alternative Energy Sources and Globalization: The Road Ahead. Orlando, FL, Nov. 15 Is grain sorghum an alternative for ethanol production? Teresa Duch-Carvallo | Jaime Malaga Texas Tech University
OUTLINE • BACKGROUND • OBJECTIVES • EQUATIONS • MODEL ESTIMATION AND VALIDATION • FORECAST SCENARIOS • CONCLUSION
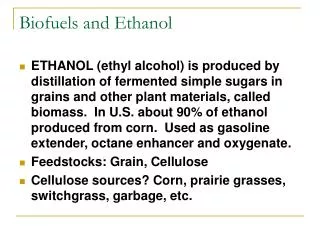
Background • Ethanol industry has been expanding rapidly due to the need of reduce MTBE and other ethers from gasoline and higher oil prices. • Concentration of ethanol production in the Corn Belt has caused the price of this grain to increase and affect the feed and food sectors of economy. • Sorghum could be an alternative grain in ethanol production. • United Sorghum Check-off Program. • Sorghum industry has become highly dependent on foreign markets. • Mexico-U.S. relationship.
OBJECTIVES • To construct a partial equilibrium econometric and simulation model including supply, demand and trade components between Mexico and U.S. • Estimation of a medium term baseline forecast and simulate the effects of plausible alternative scenarios on critical endogenous variables.
Model estimation and validation • Spatial and partial equilibrium model. • The model contained equations of demand and supply of GS for the US and Mexico, and a price transmission equation. • Once the model was estimated, validation was carried on by means of the Theil's inequality coefficient (U).
DEMAND SIDE • United states • Demand as feed (QSF) • QSFUSt = f (sorghum and corn prices, time trend) • Total quantity demanded (QSD) • QSDUSt = QSFUSt + QSOUUSt + StocksSUSt + QXSROWUSt,
DEMAND SIDE • Mexico • Demand as feed (QSF) • QSFMXt = f (ratio of sorghum to corn prices, chicken production and other variables) • Total quantity demanded (QSD) • QSDMXt = QSFMXt + QSOUMXt + StocksSMXt
SUPPLY SIDE • United states • Sorghum planted area (PAS) was divided into two equations: • TX and other Southern states • PASTXt = f (Lagged sorghum price and planted area, ratio of harvested cotton area to planted area, other variables) • Rest of the US • PASOSt= f (Lagged sorghum price and planted area, other variables) • Total PAS in the US • PASUSt = PASTXt + PASOSt
SUPPLY SIDE • Mexico • Sorghum planted area (PAS) • PASMXt = = f (Lagged sorghum price and planted area, other variables) • Both countries • Volume produced (VolS) • VolSt = PASt * (PASt / HASt) * Yieldt • Total quantity supplied (QSS) • QSSt = VolSt + StocksSt-1
Price • United States • Gulf Coast FOB • Mexico • Equilibrium price of sorghum in the U.S. and Mexico should be highly correlated • Sorghum price • PSMXt = f (PSUSt ER),
Market clearing conditions • United States • Excess supply • ExSupUSt = QSSUSt – QSDUSt, • Mexico • Excess demand • ExDemMXt = QSDMXt – QSDMXt • Equilibrium • MKTEq = ExSupUSt– ExDemMXt
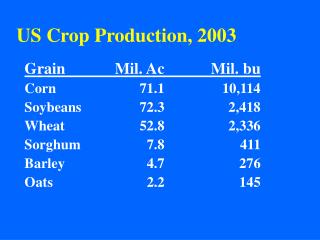
Data • Equations were estimated simultaneously using SUR. • Data base included observations on all variables from 1970 to 2008. • Data on production variables for both countries were obtained from PS&D.
data • Prices of corn and sorghum in Mexico were obtained from SAGARPA. • Prices of corn and sorghum in USA were obtained from ERS – USDA. • Prices of corn and sorghum in both countries were deflated to prices of 2002.
Forecast scenarios • Forecast period from 2009 to 2018. FAPRI’S projections on variables determined outside the model. • Increase of U.S. sorghum yield: • Baseline 1% annually. • Forecast 5% annually up to 2011 and 1% afterwards (S1). • Forecast replacement of 10% of the amount of corn used for ethanol for sorghum (S2).
Forecast scenarios • Combination of scenarios 1 and 2 (S3). • 5% annually up to 2011 and 1% afterwards. • Forecast replacement of 10% of the amount of corn used for ethanol for sorghum.
conclusion According to the results, increasing the demand of sorghum for ethanol would force a redistribution of the domestic demand. Feed demand would decrease and less amount of sorghum would be available for exports. The supply side would remain constant. Finally, we can say that at this point, the GS industry is not prepared to respond successfully to an increase of GS demand derived from ethanol production growth.