Download
1 / 28
280 likes | 305 Vues
Explore a proposed set of indicators for sustainable water resource management, addressing availability, quality, human uses, environmental health, and infrastructure. Learn about the iterative indicator identification process and essential relationships for water sustainability.

E N D
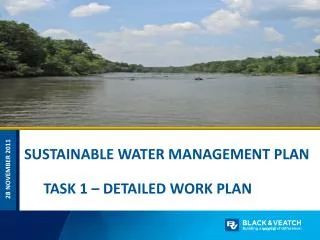
Sustainable Water Resource Use: Proposed Indicators Rhonda Kranz November 15, 2007
Sustainable Water Resources Roundtable A national collaboration of federal, state, local, corporate, non-profit, and academic interests
Our Mission To promote sustainability of our nation’s resources through … • Evaluation of information • Development & use of indicators • Targeting of research • Engagement of people & partners
Principles of Water Sustainability • The value & limits of water • Shared responsibility • Equitable access • Stewardship
Essential Relationships of Sustainability Biophysical Environment Economic System Ecosystems Social System
Fisheries Systems Perspective Biophysical Environment Economic System Fisheries laws, institutions, customs and communities Aquatic & related ecosystems Markets, capital and labor Social System
Information Pyramid Fewer Pieces Of Information Stories Criteria Indicators More Pieces Of Information Measurements
Ecosystem Processes& SocietalDrivers Ecosystems Society Natural Processes: Disturbance & Response Energy Cycling Hydrologic Cycle & Flow Regime Materials Cycling Social & Economic Drivers: Economic Development Energy Production and Use Land Use Population Growth Transportation Ecosystem goods & services time time Human alterations & discharges
Indicators Measures that present trends and information relevant to water sustainability in a readily understandable way
Indicator Roles and Uses • Local – Regional – National – International • Government – industry – academic – NGO (environmental, health, community, etc)
Iterative Indicator Identification Process • 386 candidate indicators • Initial framework • Meetings and discussion/revisions • Current proposed 5 part framework
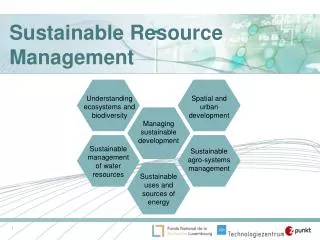
Proposed Framework for Organizing Water Sustainability Indicators • Water availability • Water quality • Human uses and health • Environmental health • Infrastructure and institutions
A. Water Availability • Renewable water resources • Water in the environment • Water use sustainability
Water Use Sustainability Withdrawals as a % of available precipitation, 1995 Figure 4.16.1 Total Freshwater Withdrawal in 1995 (as a percent of available precipitation) Source: S. Roy, K. Summers and R. Goldstein
B. Water Quality • Quality of water for human uses • Quality of water in the environment • Water quality sustainability
Impaired Waters (U.S. EPA, 2002)
C. Human Uses and Health • Withdrawal and use of water • Human uses of water in the environment • Water-dependent resource use • Human health
Reported Incidence of Waterborne Disease
D. Environmental Health • Indices of biological condition • Amounts and quality of living resources
Environmental Conditions Overall national and regional coastal condition between 1997 and 2000 Source: U.S. EPA, December 2004. National Coastal Condition Report II. Office of Research and Development/Office of Water. EPA-620/R-03/002.
E. Infrastructure and Institutions • Capacity and reliability of infrastructure • Efficacy of institutions
Population Lacking Complete Plumbing Source: Rural Community Assistance Partnership 2004
Some Key SWRR Tasks • Continue to refine the indicators • Continue to consult with other indicator initiatives and find ways to make sure are efforts are complimentary and not duplicative • Target sectors which have not had a lot of input • Address scalability of indicators to local, regional, national, international levels.