Download
1 / 19
190 likes | 412 Vues
Partnership for Sustainable Urban Transport in Asia: Indicators of Sustainable Transport. Lee Schipper Director of Research EMBARQ http://embarq.wri.org. Sustainable Urban Transport in Asia. Background - SIDA

E N D
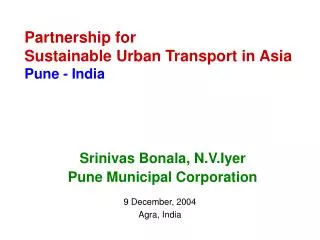
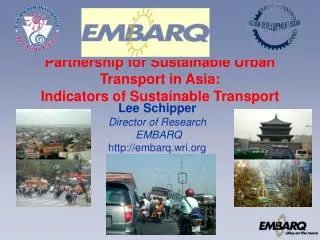
Partnership for Sustainable Urban Transport in Asia:Indicators of Sustainable Transport Lee Schipper Director of Research EMBARQ http://embarq.wri.org
Sustainable Urban Transport in Asia • Background -SIDA • Swedish International Development Authority asked ADB to carry out study of sustainable urban transport in Asian Cities • Background -ADB • ADB has been a leading actor in developing and funding transport project in Asia • ADB co-founded and supports the city-based Clean Air Initiative for Asian Cities • Background -EMBARQ • Founded by a grant from the Shell Foundation to World Resources Institute 2002 • Leading NGO in developing and carrying out sustainable transport projects (Mexico City, Shanghai) • Invited by ADB (as partner) to carry out this project All Partners Want The Project To Lead To Action
Partnership for Sustainable Urban Transport In Asia • Scope • Transport and environment in Asian cities, focusing on strengthening sustainability of low-emissions transport and mobility in Asian cities.. • Work with Pune (India), Xi’an (China), and Hanoi to engage key stakeholders and leaders • Goal • Contribute towards enhancing environmental sustainability of transport and mobility in Asian cities through developing and applying quantitative measures of sustainability and progress towards sustainability in a number of selected cities. • Purpose • Develop and discuss a conceptual approach of city-based sustainable transport planning relevant for Asia, by stimulating authorities to act!
OPERATIONAL GUIDELINEWHAT WE ARE DOING IN EACH CITY?Starting with Policy Goals… • Agree on a set of key indicators of sustainable urban transport that can guide policy planning, based on current and future strategies. • Map the gap of missing information and indicators. • Map how to close the gap. • Recommendations, including lessons re-learned from the development of indicators
Economic Expansion Government Clean Air Nice commutes State government Civil Society Business National Government NewBusiness Opportunities More rational development PressureforTransformation Changing World Politics Bi-laterals Bus rapid transit Clean diesel/CNG Smart Cards Bus, rail , metro skytrain Two or four strokes? SustainableDevelopment Asian Cities Today PSUTA’s Job: Develop indicators with city authorities, who will chose options and act Congestion Air Pollution Perilous Commutes Little personal security and safety
SUSTAINABLE TRANSPORT GOAL: IMPROVED QUALITY OF LIFE Vision of Sustainable Transport TRANSPORT FOR ALL WITH NO COSTS LEFT FOR THE FUTURE Operationalize Sustainable Transport Transport with minimal pollution, low accident rates, With affordable, comfortable access to all, supporting And supported by an economically healthy transport industry. Must have/be: Balance – equity – clean –robust—rapid Operational criteria: Affordable, implementable, enforceable Criteria “The Depths” for specialists Raw data, measurements, survey results Road, rail, coastal/harbor, and NMT infrastructure Distances and modal splits; speeds, congested roads Transport fares/costs; Safety measures and laws Details by city on vehicles, air quality, emissions controls and fuel quality
Vision of Sustainable Transport: How can we measure progress towards the vision? Governance Sustainability Well functioning, well-informed governance Stakeholders welcome Clear rules respected by all Economic sustainability –innovation and efficiency • Transportation industry is thriving economically, providing save, reliable, affordable service • Environmental sustainability – health of future citizens • “the Null Vision” Transportation causes very few deaths through pollution or accidents Social sustainability – equity • Transportation system open to all, serving all
Main Categories of Indicators • Policy – Support Leaders’ Visions • Summarize key facts and trends or goals about transport and environmental sustainability, • Show rates of improvement (or worsening) • Appropriate for highest level policy makers • Predictive – Provide tools for experts • Used to make policy indicators • Provide predictive or explanatory power for policy indicators • Used among experts or policy advisors • Background material – Ingredients of other indicators • Raw data, measurements, survey results • Output of models • Used by experts to build predictive and policy indicators
Indicators: Methodological Criteria MEASURABILITY FREQUENCY AND REPEATABILITY ACCURACY USEFUL INDICATORS COMPARABILITY TRANSPARENCY
SUSTAINABLE TRANSPORT: FROM INDICATORS TO IMPLEMENTATION 6) Market and Communicate –Publicized success and admit failures, to build for a stronger round of new policies and measures 1) Diagnose- Measure and analyze what is wrong with the present transport system, and what is worrisome about trends. . 2) Choose and implement the Cure- Analyze costs, benefits, time scales, stakeholder needs, risks of strategies to improve transportation 5) Rebalance– Apply remedial strategies where original policies or technologies not likely to achieve goals STRATEGY DEVELOPMENT 4) Evaluate– Compare new trends after policies implement with prognoses 3) Prognose– Develop baseline and alternatives to illustrate impacts of strategies choosen
Indicators of Sustainable Transport: Quantify major externalities • Congestion/Access: • Vision of minimal time lost. • Policy • Time lost in traffic; • Economic costs of congestion rel. to GDP; • Proximity to rapid transport nodes • Predictive • Modal splits, distances • Road hierarchy • Non-road transport infrastructure (rail, etc.) • Lane or road-km per vehicle and per sq.km of city space • Number of light duty vehicles Accidents/Safety: “Zero fatality vision” Policy • Deaths or accidents per vehicle • Deaths or accidents per km driven or traveled • Accident Costs/GDP Predictive • Engineering (seatbelts, safety devices, road barriers, etc) • Education (drier ed, drunken driving) • Enforcement (drunken driving, safety inspections;speed and other violations) Pollution/Air quality: Vision of no days exceeding health norms Policy • Health risk/morbidity from pollution /exposure • Concentrations in air of mobile source pollution • Health costs/GDP • Emissions/km from vehicles • Current/proposed standards and policies Predictive • Emissions coefficients and driving cycles • Number of vehicles and distance/vehicle • Verification • Socio-demographic and socio-economic variables
INDICATORS OF SUSTAINABLE TRANSPORT CLEAN ENVIRONMENT AND POLLUTION • Policy Indicators Highest Level • Reduction in overall pollution (index or days polluted) • Days exceeding WHO or local norm for ozone or PM • Economic and health costs of pollution • Expert Level – NGO, Policy Advisor • Health/morbidity from air pollution • Ambient concentrations of pollutants relative to norms • Average, new vehicle, and proposed emission norms (gm/km) • Share of existing vehicles not meeting norms (smokers, etc.) • Predictive – Specialists and Governance • Emissions factors and driving cycles by vehicle type • Number of light duty vehicles, distances driven • Verification/monitoring/enforcement requirements • Exposure of different sociodemo groups or geog. regions
Health Cost of Air Pollution Money Health costs of Transport-related Air pollution Number of people with Respiratory disease Medical and disability expenses Days of hospitalization or home sick From respiratory ailments Public Health data on respiratory illnesses, morbidity Estimates of local exposure by activity (home, on street Other activities, etc) Local Results of Ambient Air Quality Model Total GDP of region. Health Care expenditures Wages and other measures of value of time
Example of Decision Pyramid: Reducing Air Pollution Pressure to improve from NGOs Mitigation Improved fuel Retrofit of vehicles I/M and elimination of smokers ;Decision tools -> Policy options Danger Signal to the Mayor? Inputs to diagnosis Pollutant by type, vehicle(emissions/km*kilometers) for each vehicle type, fuel Ambient air analysis Measure, borrow, or guess each parameter? Detailed Data: survey of cars, driving, fuel use and emissions coefficients, model of car fleet by vintage, type, etc
Steps to More Accurate Inventories + Vehicles by type, fuel, age from reg. Distance/vehicle from “Lents-like” survey* Emissions coefficients from limited testing (Shanghai soon, few other 3rd World Cities) Accuracy Vehicles by type, fuel from reg. data Assumed distance/vehicle “Default” emissions coefficients (Much of 3rd World) , Vehicles by type, fuel,,age, tech from large vehicle use survey Distance/vehicle by type, fuel, age from vehicle-use survey “Emissions coefficients from large-scale measurement survey (Some OECD cities – London?) - Existing Improved, maybe OK?Sufficient for Action *Lents (UC Riverside) survey, or insurance or police data using odometers readings from collisions, infractions
Transport and Emissions in Bangalore WHEN DO WE SEE ALL PSUTA CITIES? For year 2000. Source: Hans Oern, Contrans
INDICATORS OF SUSTAINABLE TRANSPORT SAFETY AND ACCIDENTS • Policy Indicators Highest Level • Reduction in accident/fatality rate (per veh or km) • Accidents and fatalities per veh. or per km. • Economic and health costs of accidents • Low or no crime in the transport system • Expert Level – NGO, Policy Advisor • Accidents by modal status of victim (driver, passenger, walker) • Days lost from accidents • Accidents by cause (alcohol, speed, other infractions etc) • Safety requirements in vehicles, roads, walkways, etc. • Crime (robberies, assault, etc) on public or private transport • Predictive – Specialists and Governance • Laws and enforcement for safety, drunk driving • Driver training and licensing requirements • Safety inspection requirements, enforcement • Safety signing, restraints, graded crossings, etc. • Law enforcement and security measures in transport system
PSUTA: THE BEST FOOT FORWARD • COMPLETE CITY BASED WORK • Map the Gap • Identify experts to bridge the gap, cross the bridge • Outreach to other stakeholders • IDENTIFY COMMON PROBLEMS, SOLUTIONS • Develop strategic framework to scale up efforts • Bring in Asia-wide stakeholders (eg. Honda, Shell) • Scale up efforts • NEXT STEPS • Focus on 1 PSUTA City and engage: • Develop generic indicators tool and package • Fill the Gap with good policies and technologies Authorities Must Want Indicators as Tools EMBARQ is a Partner but Basic Motivation Comes from the City Partners themselves
By 2015 there will be 23 mega-cities, and nearly 300 cities in the developing world are already 1 million strong • Created at WRI by Shell Foundation • Mission is to work closely with • empowered forces in urban areas to • solve transport/environment problems • Working in Mexico City and Shanghai • Now in Xi’an , Pune and Hanoi • http://www.embarq.wri.org/en/index.htm