Download
1 / 1
10 likes | 90 Vues
Poster under http://www.stecf.org/poa/PF_STIS.ppt Proceedings text under http://www.stecf.org/poa/PF_STIS.pdf. [ADASS 2003 A. Modigliani & M. Rosa]. 1) Data Flow Group -European Southern Observatory Garching, Germany

E N D
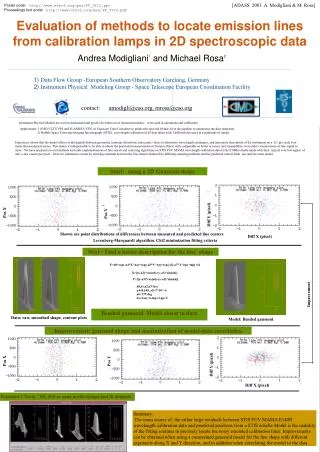
Poster underhttp://www.stecf.org/poa/PF_STIS.pptProceedings text under http://www.stecf.org/poa/PF_STIS.pdf [ADASS 2003 A. Modigliani & M. Rosa] 1) Data Flow Group -European Southern Observatory Garching, Germany 2) Instrument Physical Modeling Group - Space Telescope European Coordination Facility Evaluation of methods to locate emission lines from calibration lamps in 2D spectroscopic data contact: amodigli@eso.org, mrosa@eso.org Instrument Physical Models are used to understand and predict the behavior of instrument modes – to be used in operations and calibration Applications: 1) ESO VLT UVES and FLAMES-UVES: a) Exposure Time Calculator to predict the spectral format, b) in the pipeline to automatise the data reduction. 2) Hubble Space Telescope Imaging Spectrograph (STIS), wavelength calibration of all data taken with 3 different detectors in a multitude of modes Experience shows that the model allows to distinguish between geometric (camera) distortions, inaccurate values in laboratory wavelength catalogues, and inaccurate description of the instrument on a 0.1 pix scale over many thousand pixel across. This makes it indispensable to be able to obtain the positional measurements of features (lines) with comparable or better accuracy and repeatability even under circumstances of low signal to noise. We have analyzed several methods and code implementations of line search and centering algorithms on STIS FUV MAMA wavelength calibration data in the E140H echelle mode with their typical very low signal of only a few counts per pixel.. Here we summarize results by showing residuals between the line centers obtained by differing centering methods and the predicted centers from one and the same model. Start: using a 2D Gaussian shape Pos X Diff Y (pixel) Pos Y Diff X (pixel) Shown are point distributions of differences between measured and predicted line centers Diff X (pixel) Levenberg-Marquardt algorithm. Chi2 minimization fitting criteria Andrea Modigliani1 and Michael Rosa2 Next - Find a better description for the line shape F=a0*exp(-a4*X^nx)*exp(-a5*Y^ny)*exp[-(X-a7*Y^np)^mp]+a1 X=[(x-a2)*cos(a6)-(y-a3)*sin(a6)] Y=[(y-a3)*cos(a6)-(x-a2)*sin(a6)] a0,a1,a2,a3 free a4=0.105, a5=7*10^-6 a6=175 deg nx=2,ny=6,mp=2,np=2 Improvement Bended gaussoid Model closer to data Data: raw, smoothed shape, contour plots Model: Bended gaussoid Improvement: gaussoid shape and maximization of model-data correlation Pos X Pos Y Diff Y (pixel) Diff X (pixel) Provided 5 Tools / IDL GUI to ease profile shape and fit analysis Summary: The main source of the rather large residuals between STIS FUV MAMA E140H wavelength calibration data and predicted positions from a STIS echelle Model is the inability of the fitting routines to precisely locate the noisy extended calibration lines. Improvements can be obtained when using a constrained gaussoid model for the line shape with different exponents along X and Y direction, and in addition when correlating the model to the data.


![Near Infrared Emission Lines From Planetary Nebulae: Lines from H 2 and [Fe III]](https://cdn3.slideserve.com/6332708/near-infrared-emission-lines-from-planetary-nebulae-lines-from-h-2-and-fe-iii-dt.jpg)