CALIBRATION METHODS
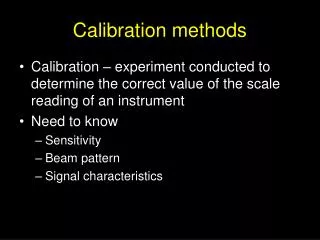
CALIBRATION METHODS. For many analytical techniques, we need to evaluate the response of the unknown sample against a set of standards (known quantities). This involves a calibration!. Determine the instrumental responses for the standards. Find the response of the unknown sample.

CALIBRATION METHODS
E N D
Presentation Transcript
For many analytical techniques, we need to evaluate the response of the unknown sample against a set of standards (known quantities). This involves a calibration! • Determine the instrumental responses for the standards. • Find the response of the unknown sample. • Compare the response of the unknown sample to that from the standards to determine the concentration of the unknown.
Example 1 I prepared 6 solutions with a known concentration of Cr6+ and added the necessary colouring agents. I then used a UV-vis spectrophotometer and measured the absorbance for each solution at a particular wavelength. The results are in the table below. Corrected absorbance = (sample absorbance) – (blank absorbance)
Calibration curve: Response = dependant variable = y Concentration = independant variable = x
I then measured my sample to have an absorbance of 0.418 and the blank, 0.003. I can calculate the concentration using my calibration curve. y = 0.0750x + 0.0029 Abs = (0.0750 x Conc) + 0.0029 Conc = (Abs – 0.0029)/0.0750 For my unknown: Corrected absorbance = 0.418 – 0.003 = 0.415 Conc = (0.415 – 0.0029)/0.0750 Conc = 5.49 mg.l-1 Check on your calibration curve!!
Absorbance = 0.415 Conc = 5.49 mg.l-1
How do we find the best straight line to pass through the experimental points???
METHOD OF LEAST SQUARES • Assume: • There is a linear relationship. • Errors in the y-values (measured values) are greater than the errors in the x-values. • Uncertainties for all y-values are the same. Minimise only the vertical deviations assume that the error in the y-values are greater than that in the x-values.
Recall: Equation of a straight line: y = mx + c where m = slope and c = y-intercept We thus need to calculate m and c for a set of points. Points = (xi, yi) for i = 1 to n (n= total number of points)
xi yi xiyi xi2 0 0.000 0 0 1 0.076 0.076 1 2 0.161 0.322 4 4 0.295 1.180 16 6 0.462 2.772 36 8 0.598 4.784 64 xi = 21 yi = 1.592 xiyi = 9.134 (xi2) = 121 Example 1 Slope: y-intercept:
The vertical deviation can be calculated as follows: di = yi – (mxi + c) Some deviations are positive (point lies above the curve) and some are negative (point lies below the curve). • Our aim to reduce the deviations • square the values so that the sign does not play a role. di2 = (yi – mxi - c)2
xi yi di di2 0 0.000 -0.0029 8.41 x 10⁻⁶ 1 0.076 -0.0025 6.25 x 10⁻⁶ 2 0.161 0.0077 5.93 x 10⁻⁵ 4 0.295 -0.0079 6.24 x 10⁻⁵ 6 0.462 0.0095 9.02 x 10⁻⁵ 8 0.598 -0.0041 1.68 x 10⁻⁵ (di2) = 2.43 x 10⁻⁴ Example 1
Standard deviation for the slope (m): Standard deviation for the intercept (c): Estimate the standard deviation for all y values.
xi xi2 di2 0 0 8.41 x 10⁻⁶ 1 1 6.25 x 10⁻⁶ 2 4 5.93 x 10⁻⁵ 4 16 6.24 x 10⁻⁵ 6 36 9.02 x 10⁻⁵ 8 64 1.68 x 10⁻⁵ xi = 21 (xi2) = 121 (di2) = 2.43 x 10⁻⁴ Example 1 Sy = 7.79 x 10⁻³ Sy2 = 6.08 x 10⁻⁵ Sm2 = 1.28 x 10⁻⁶ Sm = 0.00113 Sc2 = 2.58 x 10⁻⁵ Sc = 0.00508
Sy = 7.79 x 10⁻³ Sm = 0.00113 Sc = 0.00508 What does this mean? Slope = 0.075 0.001 Intercept = 0.003 0.005 The first decimal place of the standard deviation is the last significant figure of the slope or intercept.
CORRELATION COEFFIECIENT used as a measure of the correlation between two variables (x and y). The Pearson correlation coefficient is calculated as follows: r = 1 An exact correlation between the 2 variables r = 0 Complete independence of variables In general:0.90 < r < 0.95 fair curve 0.95 < r < 0.99 good curve r > 0.99 excellent linearity
xi yi xiyi xi2 yi2 0 0.000 0 0 0.000 1 0.076 0.076 1 0.00578 2 0.161 0.322 4 0.0259 4 0.295 1.180 16 0.0870 6 0.462 2.772 36 0.213 8 0.598 4.784 64 0.358 xi = 21 yi = 1.594 xiyi = 9.134 (xi2) = 121 (yi2) = 0.690 Example 1 Correlation coefficient:
Note: • A linear calibration is preferred, although a non-linear curve can be used. • It is not reliable to extrapolate any calibration curve. • With any measurement there is a degree of uncertainty. This uncertainty is propagated as this data is used to calculate further results.
STANDARD ADDITION In a sample, the analyte is generally not isolated from other components in the sample. The MATRIX is: Some times certain components interfere in the analysis by either enhancing or depressing the analytical signal matrix effect. BUT, the extent to which the signal is affected is difficult to measure.
How do we circumvent the problem of matrix effects? STANDARD ADDITION! Add a small volume of concentrated standard solution to a known volume of the unknown. Assumption: The matrix will have the same effect on the analyte in the standard as it would on the original analyte in the sample.
Example 2 Fe was analysed in a zinc electrolyte. The signal obtained from an AAS for was 0.381 absorbance units. 5 ml of a 0.2 M Fe standard was added to 95 ml of the sample. The signal obtained was 0.805.
Note that when we add the 5 ml standard solution to the 95 ml sample solution, we are diluting the solutions. Total volume = 100 ml. Thus we need to take the DILUTION FACTOR into account. Therefore: Or we could use: CiVi = CfVf
Fe was analysed in a zinc electrolyte. The signal obtained from an AAS for was 0.381 absorbance units. 5ml of a 0.2 M Fe standard was added to 95 ml of the sample. The signal obtained was 0.805. For the mixture of sample and standard: = Final conc of sample = Final conc of std Hence:
How is this best done in practise? The solutions in all the flasks all have thesame concentration of the matrix. Add a quantity of standard solution such that the signal is increased by about 1.5 to 3times that for the original sample. Analyse all solutions.
The result: standard 5 mL sample
Example 3 Gold was determined in a waste stream using voltammetry. The peak height of the current signal is proportional to concentration. A standard addition analysis was done by adding specific volumes of 10 ppm Au solution to the sample as shown in the table below. All solutions were made up to a final volume of 20 ml. The peak currents obtained from the analyses are also tabulated below. Calculate the concentration of Au in the original sample.
1 - Calculate the concentration of added Au to each sample. CiVi = CfVf
2 - Find the best straight line y = 6.50x + 8.68
3 - Extrapolate to the x-axis (y=0) y = 6.50x + 8.68 4 - Take dilutions into account Conc of original sample = 2.66 ppm
INTERNAL STANDARDS An internal standard is a known concentration of a compound, different from the analyte, that is added to the unknown. Why add an internal standard? The signal from the analyte is compared to the signal from the internal standard when determining the concentration of analyte present. If the instrument response varies slightly from run to run, the internal standard can be used as an indication of the extent of the variation.
Assumption: If the internal standard signal increases 10% for the same solution from one run to the other, it is most likely that the signal from the sample also increases by 10%. Note:If there are 2 different components in solution with the same concentration, they need NOT have the same signal intensity. The detector will generally give a different response for each component.
Say analyte (X) and internal standard (S) have the same concentration in solution. The signal height for X may be 1.5 times greater than that for S. The response factor (F) is 1.5 times greater for X than for S.
DETECTION LIMITS All instrumental methods have a degree of noise associated with the measurement. limits the amount of analyte that can be detected. Detection limit – the lowest concentration level that can be determined to be statistically different from the analyte blank. Generally, the sample signal must be 3x the standard deviation of the background signal