Psychology Study Basics: Composite Variables & Mean Differences
200 likes | 228 Vues
Learn about conducting experiments in psychology, creating unit-weighted composite variables in SPSS, comparing mean differences using Cohen’s d, and more. Understand the importance of composite scores and reverse-scored items in psychological research. Explore how to create unit-weighted composites, standardized mean differences, and interpret effect sizes in research. Discover how to analyze mean differences between conditions in an experiment using statistical tools like SPSS. Enhance your knowledge of experimental design and data analysis techniques.

Psychology Study Basics: Composite Variables & Mean Differences
E N D
Presentation Transcript
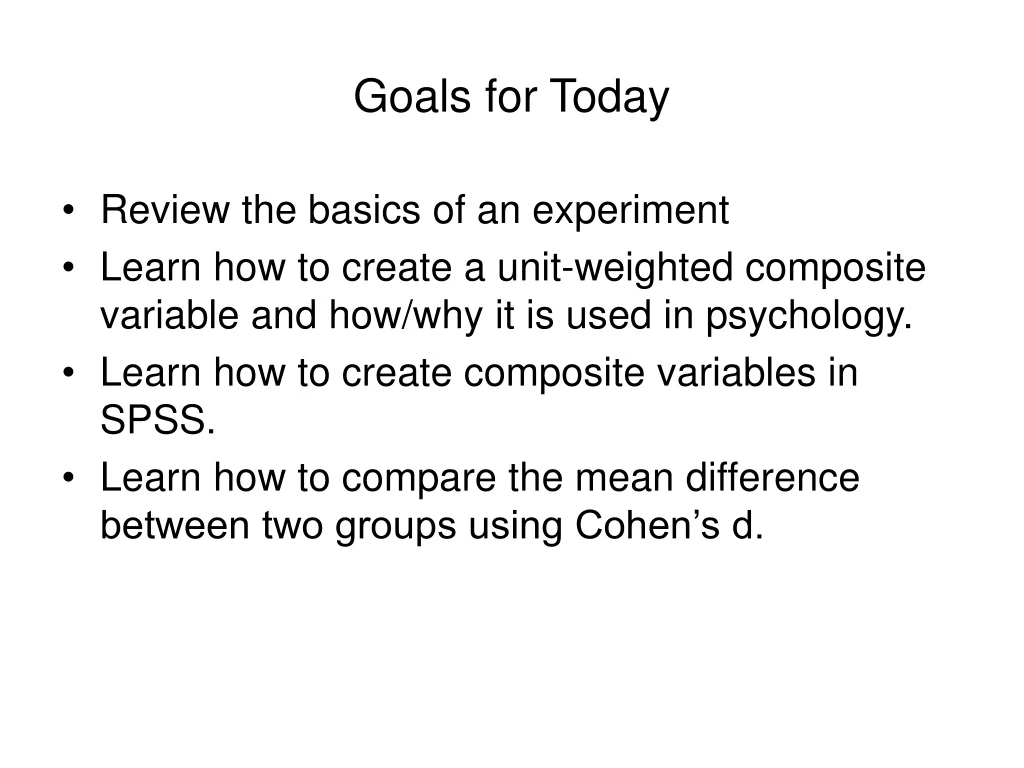
Goals for Today • Review the basics of an experiment • Learn how to create a unit-weighted composite variable and how/why it is used in psychology. • Learn how to create composite variables in SPSS. • Learn how to compare the mean difference between two groups using Cohen’s d.
Review • What is an experiment? What is random assignment to conditions and why does it matter? • What are independent vs. dependent variables in an experimental study? • What are our dependent measures/variables in our subliminal study?
Composite Scores • When we have multiple ways of assessing a construct (e.g., self-esteem), we often create a composite variable that captures the these scores.
Composite Scores • Why do we average scores together to create a composite? • We assume that a “latent” variable or “construct”, such as self-esteem, manifests itself in various ways.
Composite Scores • Each of those manifestations, however, is an imperfect reflection of a person’s self-esteem. • Example: A person may indicate that they feel good about themselves not because they feel especially good about themselves per se, but because they hold others in such low regard.
Composite Scores • O = T + E • We assume that our measurement or observation, O, is a function of at least two factors: A true score (T: the value that we expect to observe) and measurement error (E). • If the measurement errors are random, then averaging several O’s together should give us a better approximation of T.
Reverse Scored Items • Some items are negatively related to the construct of interest. • Ex: “I feel I do not have much to be proud of. ” • These items cannot be weighted in the same fashion as the others when creating a composite variable.
Unit-weighted composite • To create a “unit-weighted composite”—the most commonly used composite in personality psychology, do the following: • 1. Reverse-key responses to items that are in the opposite direction of the construct.
One way to do this is to use the following formula: • (Max - X) + Min • Thus, on a 1 (Min) to 5 (Max) scale, like the one we used: • 5 – X + 1
2. Once the appropriate responses have been reverse keyed, simply average the responses for each person.
Qualifications • This method is the simplest, but there are more complex ways of creating composite variables. • For example, sometimes responses to each variable are standardized (transformed to z-scores) before the averaging takes place. • In some work, the measurements might be weighted differently. That is, some variables might count more than others. • In other work, non-linear relationships might be assumed between the latent variable and an item response (e.g., Item Response Theory models).
Mean Differences • The big question in our experiment is whether people’s self-esteem improves after listening to a subliminal recording containing subliminal messages designed to improve self-esteem. • [open SPSS]
Our Experiment • Two conditions: • A. People in the “good” condition were presented with self-affirming subliminal messages, such as “You are a good person.” • B. People in the “bad” condition were presented with self-defacing subliminal messages, such as “No one likes you.”
Answering the Question • Did our manipulation have an impact on peoples’ self-esteem? • One way of addressing the question is by determining whether people in Condition A had higher levels of self-esteem than people in Condition B. (As measured after hearing the recording.)
Everyone has a unique self-esteem score, so we average the scores (i.e., the composite scores) for people in Condition A and separately average the scores for people in Condition B. • We want two statistics: (a) the mean, which tells us the average self-esteem value for a person in a condition, and (b) the standard deviation (SD), which tells us the amount of variability there is around the mean in that condition.
Mean Difference • Mean Difference between conditions: • (Mean of Group A – Mean of Group B) • If positive, then Group A > Group B • If negative, then Group A > Group B • If zero, then no difference between conditions.
Standardized Mean Difference • If we divide the mean difference by the average SD of the two groups, we obtain a standardized mean difference or Cohen’s d. Pooled standard deviation
Standardized Mean Difference • Cohen’s d expresses the difference between groups relative to the average standard deviation of the scores. • For Cohen's d, an effect size of 0.2 to 0.3 might be dubbed a "small" effect. Something around 0.5 might be called a "medium" effect. And values above .80 might be called “large” effects. • Handy online Cohen’s d calculator: http://web.uccs.edu/lbecker/Psy590/escalc3.htm
Another Calculation • We could also ask about the amount of change that takes place in self-esteem scores from Time 1 (before the recording) to Time 2 (after the recording). • Create a composite for the Time 1 scores. • Create a new variable in SPSS that represents the Time 2 composite – Time 2 composite scores.