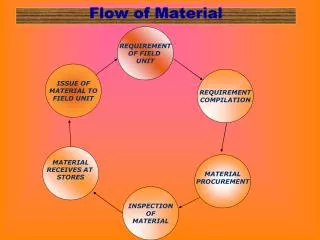
Effective Inventory Management Strategies for Optimal Performance
Learn about different types of inventory, related costs, and strategic management techniques to enhance performance. Explore cycle stock, safety stock, seasonal stock, and the impact of supply chain redesign on inventory. Discover inventory management decisions, sector-wise performance, and inventory turnover ratios. Understand inventory models and relevant costs to make informed choices.

Effective Inventory Management Strategies for Optimal Performance
E N D
Presentation Transcript
Content……. • Introduction • Type of inventory • Inventory related costs • Managing cycle stock • Managing saftey stock • Managing seasonal stock • Analysing impact of supply chain redesign on the inventory • Managing inventory for short life cycle products • Multiple item, multiple location inventory management
Sector-wise Performance on Inventory Turnover Ratio in India
Types of Inventory • Cycle Stock : Economies of scale • Safety Stock • Decoupling stocks • Anticipation Stock • Seasonal Stock • Speculative Stock • Pipeline Inventory • Dead stock
Cycle Stock • The inventory resulting from the production or purchase in batches is called cycle stocks.
Safety Stock • Stocks which are maintained as a safeguard against uncertainties of demand and supply is called safety stock.
Decoupling Stock • In most organization internal supply chain is divided into three decision units, materials, manufacturing and distributions which take care of the buy, make and deliver functions, respectively. Some organizations hold inventories at organizational as well as departmental boundaries, this is called decoupling stocks.
Anticipation Stock • Anticipation inventories consists of stock accumulated in advance of expected peak in sales or that which takes care of some special event that does not occur on a regular basis. • Seasonal stock • Speculation stock
Pipeline Inventory • Production and transportation activities take certain finite time, firms need to carry pipeline or in-transit stock. • Pipeline inventory consists of materials actually being worked or being moved from one location to another in the chain
Dead stock • Dead stock refers to that part of the no-moving inventory that is unlikely to be of any further use in supply chain operations or markets. • Dead stock essentially includes items tat have become obsolete because of changes in customer taste, design or production processes.
Inventory Management: Key Decisions • How much to order? • When to order? • Where to hold inventory? • When to review? • Continuous review systems ( Fixed order quantity) • Periodic review systems
Inventory in Chain • Supply chain consists of series of stock points connected by processes ( conversion processes and transportation processes) • Each stock point has demand process and supply process • Inventory at stock point : cycle stock, safety stock, seasonal stock • Inventory within conversion and transportation processes: pipeline inventory
Inventory Management: Relevant Cost • Ordering cost/setup cost • Inventory carrying cost • Stockout cost • Lost sale cost • Backorder cost
Ordering cost/setup cost • It include all fixed cost associated with placing an order • Administration costs involved in placing the order • Transportation cost • Receiving cost
Inventory carrying cost • It capture all the actual and opportunity costs that are incurred because of holding inventory • Financing cost • Storage and handing cost • Inventory risk
Stockout cost • It captures the economical consequences of running out of stock • Lost sale cost • Backorder cost
Cycle-stock Inventory Fixed Order Quality Model ( Cont. Review Model) Q=Order Quantity, Reorder point= L*d Average cycle stock = Q/2
Inventory Models: Cycle Stock __________ Q = 2 A D / i C A = Ordering Cost / Cost of setup D = Annual Demand i = Inventory carry cost C = cost of item Q= Optimum order quantity
Optimum Order Quantity Daily Demand = 100 Working days in year=300 Ordering cost = 256 Rs. Cost of item = 30 Rs. Inventory-carrying cost = 0.2 Rs./Rs./Year Supplier LT = 15 Days Optimum order Qty. = _______________________ • (2*256*100*300/(30*0.20 ) = 1600 Average cycle stock= 0.5* 1600 = 800 units Reorder point= 15*100 =1500
Insight from cycle stock inventory model • Fast vs. slow moving products • Importance of volume • Focus on reduction in ordering cost/set up cost
Safety Stock R= reorder point
Distribution of Demand During Lead Time Safety Stock
Ordering Policy in Case of Demand and Supply Uncertainty Order quantity = Q* = Optimum order quantity Reorder point= D * L + K Lead Time Demand K = Safety factor Safety stock= K Lead Time Demand
Impact of Safety Factor on Service Level Safety factor (K) Service level 0 0.500 0.5 0.690 1.0 0.841 1.5 0.933 2.0 0.977 2.5 0.994 3.0 0.998
Safety Stock: Demand Uncertainty Only S.S = K Lead Time Demand ______ Lead Time Demand = L D2 D = average Demand ,D = S.D. of Demand , L = Lead-time, K = Safety Factor
Safety Stock : Demand and Supply Uncertainty S.S = K Lead Time Demand ____________ Lead Time Demand = L D2 + D2 L2 D = average Demand ,D = S.D. of Demand , L = Average Lead-time, L = S.D. of Lead-time K = Safety Factor
Inventory Profile at Stock Point: Cycle Stock + Safety Stock Inventory Average Inventory Cycle Inventory Safety Inventory Time
Inventory ManagementCycle and Safety Stock Daily Demand: Mean = 100 , SD = 30 Ordering cost = 256 Rs. Cost of item = 30 Rs. Inventory-carrying cost = 0.2 Rs./Year Supplier Performance Mean = 15 Days , SD = 5 Service Level = 98%
Service level is the probability that all orders will be filled from stock during the replenishment lead time or during the reorder cycle. This is also known as cycle service level
Managing Seasonal Stock • Capacity versus inventory tradeoff in seasonal demand/supply situation • Two basic approaches in aggregate planning (Sales and operations Planning) • Chase Option : Produce as per demand • Level Option: produce at the same level • Mix approaches
Illustration: Managing Seasonal Stock Cost: level option= 18,000 Chase option= 48000
Centralized Versus Decentralized Systems • Inventory • Safety Stock • Cycle stock • Service Level • Overhead Costs • Customer Lead Time • Transportation Cost
Centralized Versus Decentralized Systems: Illustration Demand distribution at each region ( 16 regions) Daily Demand: Mean = 100 , SD = 30 Ordering cost = 256 Rs. Cost of item = 30 Rs. Inventory Carrying cost = 0.2 Rs./Rs./Year Plant Lead time:= 15 Days ( No supply Uncertainty) Transportation: Decentralized- Rs. 1 per unit Centralized case: - 10% higher
Decentralised system –16 stock points Centralised system –1 stock point Cycle stock/stock point = Q*/2 800 3200 Safety Stock per stock point 232 928 Total Inv. in units for the system (232+800) 16 = 16512 928+3200 = 4128 Total Inv. carrying cost 16512 6 = 99072 4128 6 = 24768 Incremental Transportation cost 300100160.1 =48,000
Inventory for Short life-cycle Products • Short life cycle products is a special category of items where demand takes place during a sort period of item, and good are kept ready in stock to take care of demand. • Two kinds of products • Style goods (fashion goods) • Perishable goods (news papers)
Newsboy model or Single Period Model Balancing cost of under-stocking versus cost of overstocking CU = Cost of under-stocking CO = Cost of overstocking Optimum service level = (CU *100/ (CU +CO ) Optimum Order size= Mean demand + K * Std. Dev. Demand K= optimum service level
Optimum Order for a New Music CD CD purchase price = Rs. 200 CD sales price = Rs. 300 CD sales price after first weeks = Rs. 62. Demand: Average 100 and Standard Deviation 30 • What is optimum order quantity • If manufacturer offers buyback scheme , would your decision change? • Cost of administering return- Rs. 53
Selective Inventory Control techniques • ABC classification • FSN Classification • VED Classification
ABC categorization has been used with success in following areas: • Allocation of managerial time • Improvement efforts • Setting up of service levels • Stocking decision in the distribution system