Exploring Data through Distribution Plots
Discover the world of statistics with various distribution plots. Learn to describe data, analyze relationships, and make inferences based on data models. Understand the uncertainty and probability attached to statistical analysis.

Exploring Data through Distribution Plots
E N D
Presentation Transcript
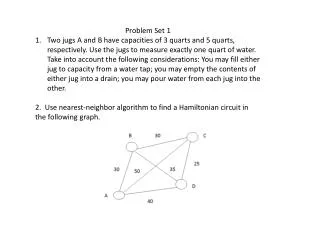
Set 1 Introduction to statistics, Distribution plots
Introduction to Statistics • Study data and draw conclusions • Describe data • Models • Methods of data collection • Random sample • Observational data • Experimental data • Inference based on data • Data viewed as a subset of a larger set of interest • Learn something about the process from data • Uncertainty of the partial knowledge, probability
Descriptive Statistics • Graphs that describe data • Distribution plots • Sequence plots • Plots that show relationship between two variables • Numbers that describe data • Averages • Percentiles • Measures of variation • Measures of relationship between two variables
Models • Models that describe distribution • Bell-shape curve, uniform, binomial • Models that describe relationship between variables • Linear relationship model • Independence model
Data • Observational unit, individual, case • Person, family, firm, a geographic unit • Variable: a characteristic of observational unit • Income, number of employees, urban/rural • Dimension of data: number of variables • Univariate • Bivariate • Multivariate
Types of Variables • Cross-sectional • Data are taken from observational units at about the same time (time doesn’t matter) • Longitudinal • Data are taken from the same observational units over time (time is a variable that matters) • Quantitative • Categorical
Qualitative Variables • Arithmetic is not applicable • Type of the firm (Industrial, financial, …) • Income level • Gender • Indicator variable (Binary 0 or 1) • Membership in a category is coded 1 • Non-members are coded 0 • The total gives the number of members 0, 1, 1, 1, 0, 0, 1, 1 Total = 5 members
Quantitative Variables • Arithmetic applicable • Continuous (measurement) • Income • Price • Age • Discrete (count) • Number of individuals in a household • Number of defective items in a box
Notations • Variable,x, or y, etc. • Data, x1, x2, . . ., xn • Number of observations,n • Example Scores on an aptitude test, x n = 10
Graph of Data • Look for: • Overall patterns • Striking deviations • Pattern of relationship
Graphical description of data • Distribution graphs for categorical data • Bar Chart • Pie Chart • Distribution graphs for quantitative data • Dotplot • Histogram • Stem plot • Boxplot • Sequence plot for (longitudinal data)
Histogram • Bar graph for continuous variables • width of the bars = intervals Usually equal width, sometimes unequal width • Height of the bars = number of data points (count, frequency) percent of data points (relative frequency) percent per unit (density); area = percent