Download
1 / 58
590 likes | 727 Vues
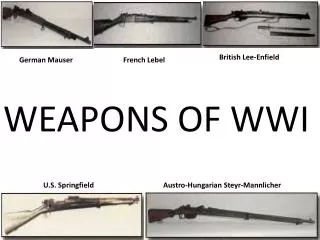
Economics of WWI. Redemption Jon Nacionales. Overview of the War.

E N D
Economics of WWI Redemption Jon Nacionales
Overview of the War • Please don’t ask me what WWI was because then I’ll be pretty disappointed. We studied the background in the social science packet. If you still don’t know anything read the Social Science packet and DemiDec and go to this really cool website that has information all about WWI: • https://www.google.com
*Most British Economic Warfare • Established naval blockade of Germany, effectively stopping ALL* American trade with the Central Powers. • Germany use U-Boats in effort to isolate Britain
France • “France suffered the greatest cost, the most extensive physical damage, and the most significant economic disruptions.” • Army of 5 million men (most came from private industry) • 1913 government spending raises by 10% • 1918 government spending raises by 53.5%
Italy • Italy had a relatively underdeveloped economy to begin with=limited mobilization • Supreme Committee of Ministers & Under-Secretariat for Arms and Munitions took over private factories and forced private firms for war benefit. • The mechanical and engineering industries and hydroelectricity experience greatest gains. Automotive industry : FIAT • “the output increases in war- related sectors were obtained largely at the cost of running down stock elsewhere”
Russia • “Backwards economy” • 1914—Income per capita was 11-30% of United States • August 1914-December 1917—24% in annual national income goes to war • Russia leaves in 1917 and America enters=limited consequences
1917—Enter America • Lusitania—May 17, 1915 • Sussex—1916 • Sussex Pledge—March 1917 • Zimmerman—March 1, 1917 • America Enters—April 6, 1917
American Mobilization • America faces same production goals as Europe + Atlantic Ocean • 24.2M men register, 2.8 fight • men received 6 mo. training prior and 2 mo. after • America sent 7.5 million tons of cargo, only 200,000 was lost • How to transport men? ½ British Ships + ½ Emergency Fleet Corporation = 2M tons of ships
The War Industries Board (WIB) Est. July 1917 • In charge of the government’s procurement of war goods • Set very high prices on goods (Price Fixing Committee aka PFC) • Bulk-line pricing system • “Under such a pricing strategy, the government would decide what fraction of an industry’s total output it needed for the war effort, and it would set a price just high enough to reach that level of output.”
Bulk Line Pricing • Demand was more than supply=Shortages • In free market prices would increase • War market prices are fixed • Government sets priority system (AA, A, B, C, D)
Parts WIB • Price Fixing Committee • The Food Administration • The Railroad Administration • The Fuel Administration
The Food Administratrion • Lever Food and Fuel Act in August 1917—Herbert Hoover • NO food rationing and price control • YES volunteer • Meatless Mondays • Wheatless days • Porkless days • Food licensing • No volunteers? No license.
The Railroad Administration • President Wilson nationalized the railway system from 1917-1920 • “unable to earn net income sufficient for them to maintain their credit and to attract new capital for needed enlargements and improvements in facilities...” • Make railroads more efficient for transporting war goods and TROOPS. • 610,000 troops every month • 13,912 trains over 800 miles
The Fuel Administration • Created by President Wilson from August 1917-1919 • Set coal prices • Work with Railroad Administration to deliver coal and fuel.
Costs of War • Net cost = Gross cost – “advances”/loans to Alliances • Total cost = indirect + direct • Total cost = $337,850,000,000
Indirect Costs • opportunity costs • property losses, shipping and cargo losses, lost production, war relief, and the capitalized value of civilian and soldier deaths • what they could’ve earned
War Financing • Borrowing • Taxation • Printing of money
United States Financing • $19 Billion from Government Borrowing: Liberty Bonds (Interest rate at 3.5-4.25%) • First Liberty Loan (April 24, 1917)—$5B at 3.5% interest • Second Liberty Loan (October 1, 1917)—$3B at 4% interest • Third Liberty Loan (April 5, 1918)—$3B at 4.5% interest • Fourth Liberty Loan (September 28, 1918)—$6B at 4.25% interest
Income Tax • 1913—16th Amendment is federal income tax saying, “We will tax your income.” • Raised 24.5% of American war spending ($7.B)
The Federal Reserve • Established December 1913 • Printed $4,400,000,000 (14.1 percent of total war expenditures) in paper money during WWI • Where did all the money go? • Buy Liberty Bonds.
Debt Financing • Debt financing is selling bonds. • Debt financing = selling bonds. • Debt financing 是selling bonds
Britain • Debt financing or selling bonds was the most importantmeans of financing war expenditures. • 1918 – British goods and services is worth £5.866 Billion. British national debt is £7.481 Billion. Debt is 127.5% of goods and services. • War loans in 1914, 1915, 1917 • Borrow from United States of America
British Taxes • Taxes raised 24.5% of war expenditures and 40% of first year war expenditures. • Raise property and income taxes. • Excise Taxes on alcohol, tobacco, tea, automobiles, and musical instruments.
France • France spent a lot of monies. • Government spending went from 10% to 50% • At first short term debt, but then long term every year. • Pre-war debt: 65% of GDP • Post-war debt: 124% of GDP
Impôts • French income taxes stayed relatively low because of opposition. • 1916—”Extraordinary War Profits” Tax has high rate, but does not make significant revenue until after the war. • “Inflation Tax” • 1915-1919: Money supply rises 20% • 1915-1919: Prices rise 19.7% • France tries stopping inflation by setting price controls, but fails.
Germany • Relies on debt financing (81 percent of war expenditures) more than Britain • War expenditures account for more than half of total spending
GDP Refresher • GDP is the dollar value of all goods and services produced within an economy in a year. There are 2 ways to measure it. • The expenditure approach is calculating total spending of different economic sectors (private households, business firms, governments, and foreign buyers). • The income approach is adding up total income in a year.
GDP and War • Wartime may experience an appearance of an increase in GDP because of the increase of war stuffs production. • NOT a good thing because it’s using capital to destroy other capital and not being detected. • Economists look at the “real” or “inflation-adjusted” in which the price level is kept constant. • http://data.bls.gov/cgi-bin/cpicalc.pl
American Growth • Pre-War recession • Onset of war leads to economic BOOM because European purchases • 1917—America enters war and boom slows down. • 2/3 of American WWI economic growth happened during neutrality
British Growth • 1913-1915—British economy contracts • 1916-End of War—Growth spurt • Overall Growth 15%
Boom, Economically • The boom is not because of consumers, but because of government
Germany • Shock • Human capital • Industry • Agriculture • 1919 inflation-adjusted income is 55%-72% 1913 income • War-related industry declines until 1915
The War Ends • June 28, 1919—Versailles Treaty • France. George Clemenceau • United States. Woodrow Wilson • England. David Lloyd George • Germans say treaty is unfair, but signs its own death warrant anyway. • Allies won, but at what cost?