Download
1 / 88
921 likes | 1.27k Vues
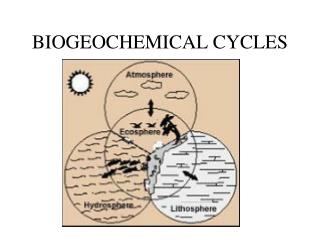
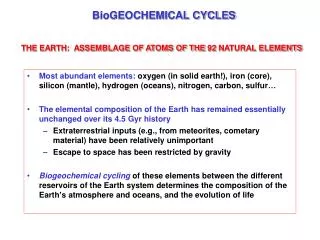
BioGEOCHEMICAL CYCLES. Most abundant elements: oxygen (in solid earth!), iron (core), silicon (mantle), hydrogen (oceans), nitrogen, carbon, sulfur… The elemental composition of the Earth has remained essentially unchanged over its 4.5 Gyr history

E N D
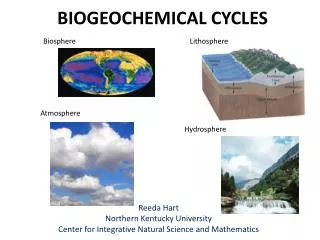
BioGEOCHEMICAL CYCLES Most abundant elements: oxygen (in solid earth!), iron (core), silicon (mantle), hydrogen (oceans), nitrogen, carbon, sulfur… The elemental composition of the Earth has remained essentially unchanged over its 4.5 Gyr history Extraterrestrial inputs (e.g., from meteorites, cometary material) have been relatively unimportant Escape to space has been restricted by gravity Biogeochemical cyclingof these elements between the different reservoirs of the Earth system determines the composition of the Earth’s atmosphere and oceans, and the evolution of life THE EARTH: ASSEMBLAGE OF ATOMS OF THE 92 NATURAL ELEMENTS
BIOGEOCHEMICAL CYCLING OF ELEMENTS:examples of major processes Physical exchange, redox chemistry, biochemistry are involved Surface reservoirs
HISTORY OF EARTH’S ATMOSPHERE N2 CO2 H2O O2 O2 reaches current levels; life invades continents oceans form CO2 dissolves Life forms in oceans Onset of photosynthesis Outgassing 4.5 Gy B.P 4 Gy B.P. 0.4 Gy B.P. 3.5 Gy B.P. present
COMPARING THE ATMOSPHERES OF EARTH, VENUS, AND MARS Venus Earth Mars Radius (km) 6100 6400 3400 Surface pressure (atm) Mass (1024 kg) 91 4.87 1 5.98 0.007 0.64 CO2 (mol/mol) 0.96 3x10⁻⁴ 0.95 N2 (mol/mol) 3.4x10⁻² 0.78 2.7x10⁻² O2 (mol/mol) 6.9x10⁻⁵ 0.21 1.3x10⁻³ H2O (atm, mol/mol) 3x10⁻³ 1x10⁻² 3x10⁻⁴ H2O (total, bars) 0.3 400 2 x 10⁻⁶
Source: EARLY EARTH Oxygen for heavy-metal fans: Lyons TW, Reinhard CT NATURE Volume: 461 Issue: 7261 Pages: 179-181 SEP 10 2009
Atmospheric Composition (average)1 ppm= 1x10⁻⁶red = increased by human activity Gas Mole fraction Nitrogen (N2) 0.78 Oxygen (O2) 0.21 Water (H2O) 0.04 to < 5x10⁻³; 4x10⁻⁶ -strat Argon (Ar) 0.0093 Carbon Dioxide (CO2) 385 370x10-6 (date: 2009 2000) Neon (Ne) 18.2x10⁻⁶ Ozone (O3) ¶ 0.02x10⁻⁶ to 10x10 –6 Helium (He) 5.2x10⁻⁶ Methane (CH4) 1.7x10⁻⁶ Krypton (Kr) 1.1x10⁻⁶ Hydrogen (H2) 0.55x10⁻⁶ Nitrous Oxide (N2O) 0.32x10⁻⁶ Carbon Monoxide (CO) 0.03x10⁻⁶ to 0.3x10⁻⁶ Chlorofluorocarbons 3.0x10⁻⁹ Carbonyl Sulfide (COS) 0.1x10⁻⁹ ¶ Ozone has increased in the troposphere, but decreased in the stratosphere.
OXIDATION STATES OF NITROGENN has 5 electrons in valence shell 9 oxidation states from –3 to +5 -3 0 +1 +2 +3 +4 +5 NH3 Ammonia NH4+ Ammonium R1N(R2)R3 OrganicN N2 N2O Nitrous oxide NO Nitric oxide HONO Nitrous acid NO2- Nitrite NO2 Nitrogen dioxide HNO3 Nitric acid NO3- Nitrate Nitrogen: Nitrogen is a major component of the atmosphere, but an essential nutrient in short supply to living organisms. Why is "fixed" nitrogen in short supply? Why does it stay in the atmosphere at all? Increasing oxidation number (oxidation reactions) free radical free radical Decreasing oxidation number (reduction reactions)
THE NITROGEN CYCLE: MAJOR PROCESSES combustion lightning free radical ATMOSPHERE N2 NO oxidation HNO3 denitri- fication biofixation deposition orgN decay NH3/NH4+ NO3- BIOSPHERE assimilation nitrification weathering burial LITHOSPHERE "fixed" or "odd" N is less stable globally=> N2
-3 -2 -1 0 1 2 3 5 N2 N2O Org N NO ? NH4+ NH2OH NO2- NO3- ? N2H4 N2 ox state -3 -2 -1 0 1 2 3 5
“There are lies, there are big lies, and then there are…box models.” • Box models are usually considered linear models. Nature isn’t linear. • It matters how you choose to divide up the problem into boxes. Box 1 Box 1 k k * 0.010 Only Box 1 k k * * 0.008 Box 1 of 2 * * * 0.006 * * * C1 or C2 * 0.004 * * * * * * * * * * 0.002 * Box 2 only * * * * * Box 2 Box 2 Only Box 2 * * * * * * * * * * * * * * * * * * * * * * * * * * * * * * * * * * * * * * * * * * * * * * * * * * * * * * * * * * * * * * * * * * * * * * * * * * * Box 2 of 2 0.0 0 2 4 6 8 10 time k=1; M1=1, M2=10; Co = .01 (M1o) C1=Co/M1+2{M2 exp(-k(M1+2/(M1M2)t) +M1 } C2=CoM1 /M1+2{1 - exp(-k(M1+2/(M1M2)t ) }
BOX MODEL OF THE NITROGEN CYCLE Inventories in Tg N Flows in Tg N yr-1
N2O: LOW-YIELD PRODUCT OF BACTERIAL NITRIFICATION AND DENITRIFICATION NH4++3/2O2 NO2+ H2O + 2 H+ NO3+ Org-C N2 + … N2O Important as • source of NOx radicals in stratosphere • greenhouse gas IPCC [2001]
N2O versus depth in the Greenland Ice sheet. Constraints on N2O budget changes since pre-industrial time from new firn air and ice core isotope measurements S. Bernard, T. R¨ockmann, J. Kaiser, J.-M. Barnola, H. Fischer, T. Blunier, and J. Chappellaz, Atmos. Chem. Phys., 6, 493–503, 2006 N2O in the atmosphere
PRESENT-DAY GLOBAL BUDGET OF ATMOSPHERIC N2O IPCC [2001] Although a closed budget can be constructed, uncertainties in sources are large! (N2O atm mass = 5.13 1018 kg x 3.1 10-7 x28/29 = 1535 Tg )
BOX MODEL OF THE N2O CYCLE 1.53 103 N2O 6 8 3 Inventories in Tg N Flows in Tg N yr-1
FAST OXYGEN CYCLE: ATMOSPHERE-BIOSPHERE Source of O2: photosynthesis nCO2 + nH2O -> (CH2O)n + nO2 Sink: respiration/decay (CH2O)n + nO2 -> nCO2 + nH2O CO2 O2 lifetime: 5000 years Photosynthesis less respiration O2 orgC orgC decay litter
…however, abundance of organic carbon in biosphere/soil/ocean reservoirs is too small to control atmospheric O2 levels
SLOW OXYGEN CYCLE: ATMOSPHERE-LITHOSPHERE O2 lifetime: 3 million years O2: 1.2x10⁶ Pg O CO2 O2 Photosynthesis decay runoff Fe2O3 H2SO4 weathering CO2 O2 orgC FeS2 OCEAN CONTINENT orgC Uplift burial CO2 orgC: 1x10⁷ Pg C FeS2: 5x10⁶ Pg S microbes FeS2 orgC SEDIMENTS Compression subduction
The cycle of organic/inorganic C, solubility of O2 in seawater, and onset of denitrification, limit the amount of nitrate in the deep ocean Dissolved O2mmole/kg Dissolved NO3-mmole/kg (C106H124O36) (NH3)16 (H3PO4) + 150 O2 => 106 CO2 + 16 HNO3 + H3PO4 + 78 H2O + energy
Antarctic Ice Core Data CO2 varies over geologic time, within the range 190 – 280 ppm for the last 420,000 years. The variations correlate with climate: cold low CO2 . Is CO2 driving climate or vice versa? The heavier temperature lines 160,000 BP to present reflect more data points, not necessarily greater variability. Source: Climate and Atmospheric History of the past 420,000 years from the Vostok Ice Core, Antarctica, by Petit J.R., Jouzel J., Raynaud D., Barkov N.I., Barnola J.M., Basile I., Bender M., Chappellaz J., Davis J. Delaygue G., Delmotte M. Kotlyakov V.M., Legrand M., Lipenkov V.M., Lorius C., Pépin L., Ritz C., Saltzman E., Stievenard M., Nature, 3 June 1999.
3 2 1 0 Year-to-year change in CO2 (ppm) (SPO+MLO)/2 RECENT GROWTH IN ATMOSPHERIC CO2 CONCENTRATIONS The average annual increase did not change much between 1970 and 2000, despite significant increases in fossil fuel emissions. Airborne fraction, CO2 (ppm) 60 62 64 66 68 70 72 74 76 78 80 82 84 86 88 90 92 94 96 98 00 02 Starting year 1 ppm = 2.1 x 10⁹ tons of C (in CO2) CO2 Airborne Fraction Average rate of increase per year, 1.5 ppm = 3.25 x 10⁹ tons/yr—little change (some variations) since 1975.
Notice: • atmospheric increase is ~50% of fossil fuel emissions • significant interannual variability Arrows indicate El Nino events
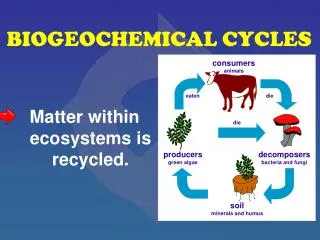
6 8 PgC/yr GLOBAL PREINDUSTRIAL CARBON CYCLE Inventories in Pg C Flows in Pg C a-1 The carbon cycle can be viewed as a set of "reservoirs" or compartments, each characterizing a form of C (e.g. trees; rocks containing calcium carbonate [limestone]). The cycle of C globally is then represented as a set of transfer rates between compartments. The total amount of carbon in the atmosphere + ocean + rocks that exchange with the atmosphere/ocean is fixed by very long-term geophysical processes. Human intervention may be regarded as manipulation of the rates of transfer between important reservoirs.
Carbon Cycle on Land • Photosynthesis: CO2 + H2O + light => "H2CO" + O2 • Respiration: "H2CO" + O2 => CO2 + H2O + energy Very little organic matter is stored, on average. Carbon Cycle in the ocean • Dissolution/evasion CO2(g) + H2O + CO3(aq) = 2 HCO3¯
Global CO2 budget (PgC yr-1 ) 1980 – 1990 1990 –2000 Fossil Fuel+ cement 5.3 Deforestation 1-2 Total 6.3 - 7.3 Atmospheric accumulation 3.2 Ocean uptake 2.1 "Missing Sink" 1-2 Total 6.3 - 7.3 6.5 .5-1 7-7.5 Sources 3.2 1.5-2 1.8-2.8 7-7.5 Sinks 2.1 Pg C = 1 ppm atmospheric CO2[source: Cias et al., Science 269, 1098, (1995)]
Composition of Sea Water Charge balance in the ocean: [HCO3-] + 2[CO32-] = [Na+] + [K+] + 2[Mg2+] + 2[Ca2+] - [Cl-] – 2[SO42-] – [Br-] The alkalinity [Alk] ≈ [HCO3-] + 2[CO32-] = 2.3x10⁻³M "alkalinity" defines Σ' Zi [i] : response of H+ and OH- to addition of CO2
Alkalinity [alk] = Σi Z+[i+] - Σi Z-[i-] = [HCO3-] + 2 [CO3=] [alk] is a re-arrangement of the charge balance equation. It cannot change when adding or removing an uncharged species like CO2. [alk] = 2 x 10⁻³ M -- only 1 in 1000 of total ions!
CO2(g) CO2.H2O CO2.H2O HCO3- + H+ ATMOSPHERE UPTAKE OF CO2 BY THE OCEANS KH = 3x10⁻² M atm-1 OCEAN K1 = 9x10⁻⁷ M Ocean pH = 8.2 pK1 K2 = 7x10⁻¹⁰ M HCO3- CO32- + H+ pK2 CO2.H2O HCO3- CO32-
Equilibrium calculation for [Alk] = 2.3x10⁻³ M CaCO3 Ca2+ + CO32- 100 200 300 400 500 CO2(g) + CO32 + H2O 2HCO3- pCO2 , ppm LIMIT ON OCEAN UPTAKE OF CO2:CONSERVATION OF ALKALINITY Charge balance in the ocean: [HCO3-] + 2[CO32-] = [Na+] + [K+] + 2[Mg2+] + 2[Ca2+] - [Cl-] – 2[SO42-] – [Br-] The alkalinity [Alk] ≈ [HCO3-] + 2[CO32-] = 2.3x10⁻³M is the excess base relative to the CO2-H2O system It is conserved upon addition of CO2 • uptake of CO2 is limited by the existing supply of CO32-: Increasing Alk requires dissolution of sediments: 2.1 2.0 [CO2.H2O]+[HCO3-] +[CO32-], 10-3M 1.9 1.8 [HCO3-], 10-3M 1.6 1.4 4 [CO32-], 10-4 M 3 2 8.6 Ocean pH 8.4 8.2 …which takes place over a time scale of thousands of years
NCO2atm=PCO2 NA = Natm NCO2aq= PCO2KH Voc (1 + K1/[H+] + K1 K2 / [H+]2 ) | | | [CO2 aq] [HCO3− ] [CO3= ] 1 : 140 : 16 CO2H2O HCO3- + H+ K1 = [ HCO3- ][ H+ ] / [ CO2H2O ] HCO3- H+ + CO3= K2 = [ CO3= ][ H+ ] / [HCO3- ] [ HCO3- ] = ( K1 /[ H+ ] ) [ CO2H2O ] ; [CO3= ] = ( K2K1 /[ H+ ]2 ) [ CO2H2O ]
EQUILIBRIUM PARTITIONING OF CO2BETWEEN ATMOSPHERE AND GLOBAL OCEAN Equilibrium for present-day ocean: • only 3% of total inorganic carbon is currently in the atmosphere But CO2(g) k [ [H+] k [ F k … positive feedback to increasing CO2 Pose problem differently: how does a CO2additiondN partition between the atmosphere and ocean at equilibrium? [ 28% of added CO2 remains in atmosphere!
FURTHER LIMITATION OF CO2 UPTAKE: SLOW OCEAN TURNOVER (~ 200 years) Uptake by oceanic mixed layer only (VOC= 3.6x10¹⁶ m3) would givef = 0.94 (94% of added CO2 remains in atmosphere) Inventories in 1015 m3 water Flows in 1015 m3 yr-1
Observed uptake of fossil fuel CO2 by the oceans compare to ~300 moles CO3=
7800 in 2005! 8200 in 2007! 6500 1990 Global Fuel Use 1980 1970 3800 History of consumption of fossil fuels. Emissions have increased by more than 2X since 1970. There rise in the last 5 years has been really dramatic. But there has not been a corresponding rise in the annual increment of CO2. In 1970 ~75% of the emitted CO2 stayed in the atmosphere, but only ~40% in 2000. 1960 1950 Year