Download

1 / 28
290 likes | 454 Vues
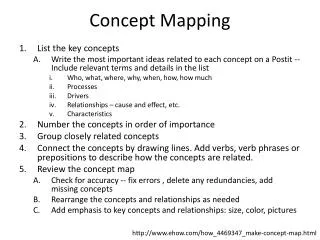
Concept Mapping as a Window into Student Understanding. William Cliff Department of Biology Niagara University. Biology Scholars Program SoTL Institute July, 2010. Types of Conceptual Learning. Meaningful Learning

E N D
Concept Mapping as a Window into Student Understanding William Cliff Department of Biology Niagara University Biology Scholars Program SoTL Institute July, 2010
Types of Conceptual Learning • Meaningful Learning • New concepts are linked to existing knowledge in a highly integrated framework of ideas • Rote Learning • New concepts are minimally linked to existing knowledge and are stored in an arbitrary, verbatim and nonsubstantive fashion From: Mintzes J. Concept Mapping in College Science. Mintzes J and Leonard W, eds. Handbook of College Science Teaching. NSTA Press, 2006.
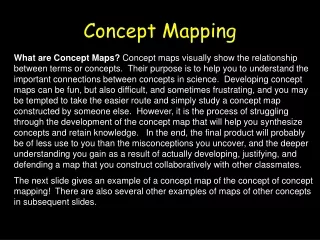
What is a Concept Map? • A 2D node-link-node diagram that depicts the most important concepts and propositions in a knowledge domain • A network of propositions where related concepts are interlinked by labeled lines
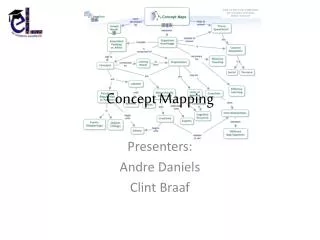
Concept Map of Concept Mapping Modified from: Novak JD & Canas AJ (2006) http//cmap.ihmc.us/Publications/Research Papers/TheoryUnderlyingConceptMaps.pdf
Concept Maps as Measuring Tools • Task • Student Response Format • Scoring System
Mapping Tasks • Fill-in skeleton map • Fill-in nodes (concepts) • Fill-in links (verbs) • Selected or free response • Self generated • Concepts provided • De novo
Example of Mapping TaskFill-in Nodes What are the cardiovascular factors that determine mean arterial pressure (MAP)? MAP
How can Concept Maps be Evaluated or Scored? • Holistically or qualitatively • Quantitatively by scoring rubrics • Structural Complexity • Content Validity • Comparison with expert maps
Structural Scoring Method First level of Hierarchy Second level of Hierarchy Propositions score 1 x 8 = 8 Hierarchies score 5 x 2 = 10 Cross-links score 10 x 1 = 10 Examples score 1 x 2 = 2 Total = 30 McClure, JR et al. J. Res. Sci. Teach. 36:475, 1999
Concept Map of Concept Mapping Modified from: Novak JD & Canas AJ (2006) http//cmap.ihmc.us/Publications/Research Papers/TheoryUnderlyingConceptMaps.pdf
Structural Scoring Rubric Propositions score 1 Hierarchies score 5 Cross-links score 10 Examples score 1 McClure, JR et al. J. Res. Sci. Teach. 36:475, 1999
Concept Map of Concept Mapping Propositions score 1 x 14 = 14 Hierarchies score 5 x 3 = 15 Cross-links score 10 x 3 = 30 Examples score 1 x 2 = 2 Total = 61 1st Level 2nd Level 2nd Level Crosslink 3rd Level 3rd Level 3rd Level Crosslink Example Example Crosslink Modified from: Novak JD & Canas AJ (2006) http//cmap.ihmc.us/Publications/Research Papers/TheoryUnderlyingConceptMaps.pdf
Relational Scoring Method West, DC et al. Med. Educ. 36:820, 2002
Valid relation score 1 x 0 = 0 Correct relation score 2 x 1 = 2 Peripheral relation score 1 x 2 = 2 Core relation score 23 x 3 = 69 Total = 74 90% Total relation score 27 x 3 = 81
Example of Expert Map from Silverthorn D. Human Physiology. An Integrated Approach. 2007
Student Maps
Causal Links between Cardiovascular Parameters on Student Concept Maps. N= 71 maps Cliff, W. Using concept mapping to assess understanding of cardiovascular physiology. FASEB J. 18:300.6, 2004.
Advantages of Concept Mappingfor Assessing Student Learning • Makes visible the complex structure of student’s declarative knowledge • Uncovers student misunderstandings • Reveals student conceptual change
Recommendations Student Training Task Selection Scoring Analysis
Further Resources • M. Zeilik. Concept Mapping. [online] www.wcer.wisc.edu/archive/cl1/flag/cat/catframe • J. Mintzes and W. Leonard, eds.Handbook of College Science Teaching. NSTA Press, 2006. • M. Ruiz-Primo and R. Shavelson. Problems and Issues in the Use of Concept Maps in Science Assessment. J. Res. Sci. Teaching. 33:569-600, 1996. • J. Nesbit and O. Adesope. Learning with Concept and Knowledge Maps: A Meta-Analysis. Rev. Edu. Res. 76:413-448, 2006.