Download
1 / 33
340 likes | 439 Vues
Learn about the devastating effects of the Christmas storm in Nebraska, its timeline, damages, and reconstruction efforts. The storm caused significant damage to transmission lines, substations, and power infrastructure in various areas. Find out how the community came together to restore power and rebuild the affected areas.

E N D
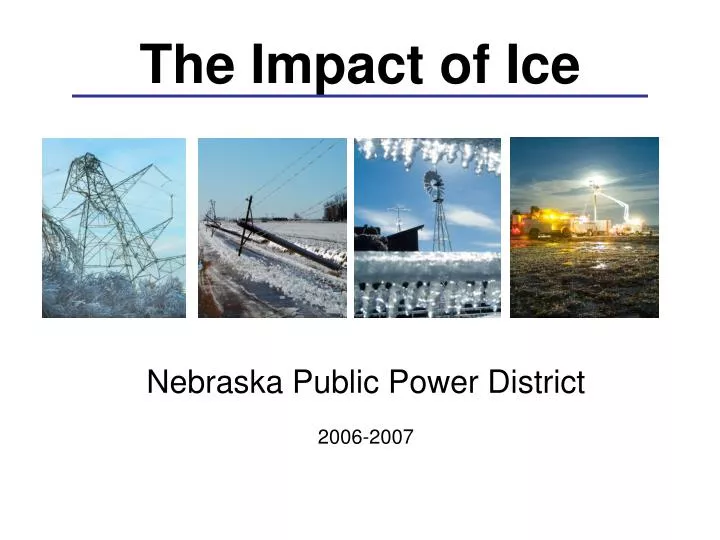
The Impact of Ice Nebraska Public Power District2006-2007
Christmas Storm Outcome • 10 transmission lines out – made temporary repairs to 8 – 2 remained out of service • 4 telecommunications fibers inoperable – no telecommunications west of Holdrege • 2,500 retail customers impacted • 21 NPPD technicians assist Dawson PPD • $1.0 Million in damages (approximate)
New Year’s Storm Timeline Friday – December 29 • Rain, freezing rain, icing, wind Saturday – December 30 • Severe icing conditions and wind • Widespread, extensive damage • Crews respond to numerous outages Sunday – December 31 • Major effort to assess damage and restore power
Back-to-Back Storms Christmas Storm: New Year’s Storm:
Normal NPPDTransmission System Grand Island Lexington Kearney Hastings Holdrege
Kearney Holdrege Kearney Area Damage Assessment # # -Wood Structures -Steel Towers -Shield Wire Miles # 63 2 42 125 314 2 18 10 43 54 5 1 10 34 52 53 109 1
Early Priorities • Kearney • Lost 4 of 5 transmission feeds • Priority restoration of second feed • Rolling blackouts during initial restoration • Holdrege • Lost all 3 transmission feeds • Mobile generation located within the community • Key Messages • Energy conservation • Fragile system • Safety
System Status – March 2, 2007 InitialCurrent • Miles assessed 2,650 • Customers without power • NPPD Retail (service restored: 1/6/07) 11,612 0 • Wholesale customers 31,000 0 • (service restored: 1/19/07) • Transmission System (approx, 71% repaired) • Number of line segments out 37 7 • Transmission miles out-of-service 1,053 184 • Number of substations out 18 0 • Miles of conductor down 301 86 • Number of structures damaged 1,136 473 • GGS east flow limitation 224 MW 990 MW • Communities on Mobile Generators 14 0 • More than a dozen public power utilities impacted by storm • Contractors on site throughout reconstruction 260 - 320 Up to Up to *These MW will depend on transmission system status, loading conditions and regional transmission system conditions.
Engineering Design Criteria • National Electrical Safety Code 1997 • Heavy combined ice and wind loading, ½ inch radial ice, 40 mph wind, 0°F • National Electrical Safety Code 2007 • Heavy combined ice and wind loading, ½ inch radial ice, 60 mph wind, 15°F • New Year’s storm • 2 inch radial ice, winds averaging 21 mph, gusts up to 40 mph, temperatures hovering around freezing
Effect of Ice on Power Lines • Typical weight of conductors without ice – ½ to 1 pound per foot • Weight of lines with ice can increase by 4 - 8 pounds per foot • Weight on structures increased up to 8 - 10 times after ice storm • Example: 115kV structure load went from 3,000 pounds to 26,000 pounds (2-inch radial ice)
More than 300 miles of line and 1,137 structures were damaged
Emergency mobile generation was brought in for 14 communities
Day-after-day diligence for more than 30 days. The last community on emergency generation was restored line service on Jan. 29, 2007.
Restore Transmission System • Material procurement and delivery • Focus on primary reconstruction efforts • Hire and assign contractors • Parallel efforts (Customer Service Priorities) • System Network Priorities • Watch the weather • Ensure equipment functions
Unloading conductor at NPPD’s York Operations Center for 400 + miles of line