Neurons, Synapses, and Signaling
1.11k likes | 1.83k Vues
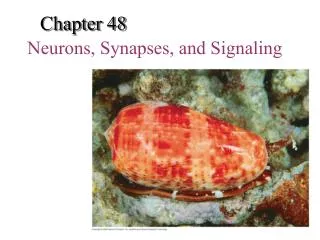
Chapter 48. Neurons, Synapses, and Signaling. © 2011 Pearson Education, Inc. Overview: Lines of Communication. The cone snail kills prey with venom that disables neurons Neurons are nerve cells that transfer information within the body

Neurons, Synapses, and Signaling
E N D
Presentation Transcript
Chapter 48 Neurons, Synapses, and Signaling
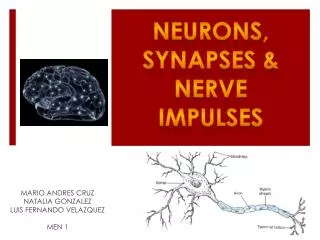
© 2011 Pearson Education, Inc. Overview: Lines of Communication • The cone snail kills prey with venom that disables neurons • Neurons are nerve cells that transfer information within the body • Neurons use two types of signals to communicate: electrical signals (long-distance) and chemical signals (short-distance)
© 2011 Pearson Education, Inc. • Interpreting signals in the nervous system involves sorting a complex set of paths and connections • Processing of information takes place in simple clusters of neurons called ganglia or a more complex organization of neurons called a brain
© 2011 Pearson Education, Inc. Concept 48.1: Neuron organization and structure reflect function in information transfer • The squid possesses extremely large nerve cells and has played a crucial role in the discovery of how neurons transmit signals
© 2011 Pearson Education, Inc. Introduction to Information Processing • Nervous systems process information in three stages: sensory input, integration, and motor output
Figure 48.2 Nerveswith giant axons Ganglia Brain Arm Eye Mantle Nerve
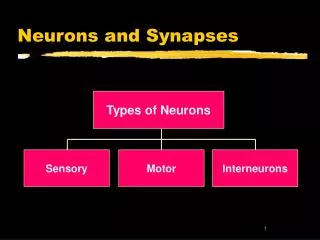
© 2011 Pearson Education, Inc. • Sensors detect external stimuli and internal conditions and transmit information along sensory neurons • Sensory information is sent to the brain or ganglia, where interneurons integrate the information • Motor output leaves the brain or ganglia via motor neurons, which trigger muscle or gland activity
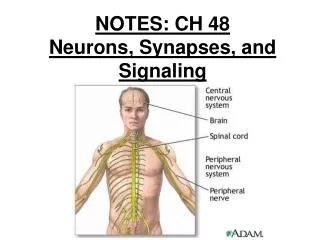
© 2011 Pearson Education, Inc. • Many animals have a complex nervous system that consists of • A central nervous system (CNS) where integration takes place; this includes the brain and a nerve cord • A peripheral nervous system (PNS), which carries information into and out of the CNS • The neurons of the PNS, when bundled together, form nerves
Figure 48.3 Sensory input Integration Sensor Motor output Effector Central nervoussystem (CNS) Peripheral nervoussystem (PNS)
© 2011 Pearson Education, Inc. Neuron Structure and Function • Most of a neuron’s organelles are in the cell body • Most neurons have dendrites, highly branched extensions that receive signals from other neurons • The axon is typically a much longer extension that transmitssignals to other cells at synapses • The cone-shaped base of an axon is called the axon hillock
Figure 48.4 Dendrites Stimulus Axon hillock Nucleus Cellbody Presynapticcell Axon Signaldirection Synapse Synaptic terminals Synapticterminals Postsynaptic cell Neurotransmitter
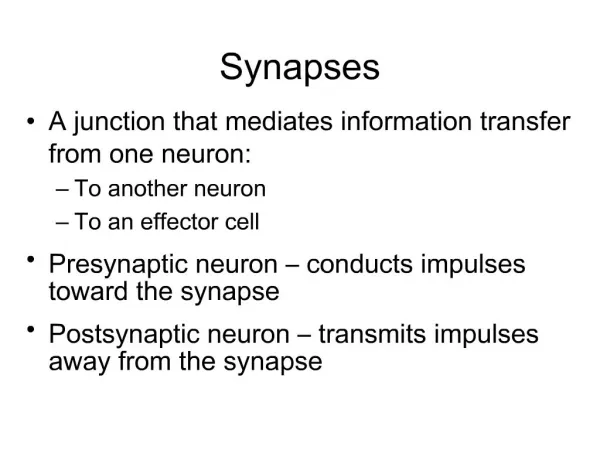
© 2011 Pearson Education, Inc. • The synaptic terminal of one axon passes information across the synapse in the form of chemical messengers called neurotransmitters • A synapse is a junction between an axon and another cell
© 2011 Pearson Education, Inc. • Information is transmitted from a presynaptic cell (a neuron) to a postsynaptic cell (a neuron, muscle, or gland cell) • Most neurons are nourished or insulated by cells called glia
Figure 48.5 Dendrites Axon Cellbody Portionof axon Sensory neuron Interneurons Motor neuron
Figure 48.6 80 m Glia Cell bodies of neurons
© 2011 Pearson Education, Inc. Concept 48.2: Ion pumps and ion channels establish the resting potential of a neuron • Every cell has a voltage (difference in electrical charge) across its plasma membrane called a membrane potential • The resting potential is the membrane potential of a neuron not sending signals • Changes in membrane potential act as signals, transmitting and processing information
© 2011 Pearson Education, Inc. Formation of the Resting Potential • In a mammalian neuron at resting potential, the concentration of K+ is highest inside the cell, while the concentration of Na+ is highest outside the cell • Sodium-potassium pumps use the energy of ATP to maintain these K+ and Na+ gradients across the plasma membrane • These concentration gradients represent chemical potential energy
© 2011 Pearson Education, Inc. • The opening of ion channels in the plasma membrane converts chemical potential to electrical potential • A neuron at resting potential contains many open K+ channels and fewer open Na+ channels; K+ diffuses out of the cell • The resulting buildup of negative charge within the neuron is the major source of membrane potential
© 2011 Pearson Education, Inc. Animation: Resting Potential Right-click slide / select “Play”
Figure 48.7 Key Na K Sodium-potassiumpump OUTSIDEOF CELL Potassiumchannel Sodiumchannel INSIDEOF CELL
© 2011 Pearson Education, Inc. Modeling the Resting Potential • Resting potential can be modeled by an artificial membrane that separates two chambers • The concentration of KCl is higher in the inner chamber and lower in the outer chamber • K+ diffuses down its gradient to the outer chamber • Negative charge (Cl–) builds up in the inner chamber • At equilibrium, both the electrical and chemical gradients are balanced
Figure 48.8 (a) Membrane selectively permeableto Na Membrane selectively permeableto K (b) ENa 62 mV EK 62 mV 90 mV 62 mV 62 mV 90 mV Innerchamber Innerchamber Outerchamber Outerchamber 150 mMNaCl 140 mMKCl 5 mMKCl 15 mMNaCl Cl K Na Cl Potassiumchannel Sodiumchannel Artificialmembrane
Figure 48.8a (a) Membrane selectively permeableto K EK 62 mV 90 mV 90 mV Outerchamber Innerchamber 140 mMKCl 5 mMKCl K Cl Potassiumchannel Artificialmembrane
© 2011 Pearson Education, Inc. • The equilibrium potential (Eion) is the membrane voltage for a particular ion at equilibrium and can be calculated using the Nernst equation Eion = 62 mV (log[ion]outside/[ion]inside) • The equilibrium potential of K+ (EK) is negative, while the equilibrium potential of Na+ (ENa) is positive
© 2011 Pearson Education, Inc. • In a resting neuron, the currents of K+ and Na+ are equal and opposite, and the resting potential across the membrane remains steady
Figure 48.8b Membrane selectively permeableto Na (b) ENa 62 mV 62 mV 62 mV Innerchamber Outerchamber 150 mMNaCl 15 mMNaCl Cl Na Sodiumchannel
© 2011 Pearson Education, Inc. Concept 48.3: Action potentials are the signals conducted by axons • Changes in membrane potential occur because neurons contain gated ion channels that open or close in response to stimuli
Figure 48.9 TECHNIQUE Microelectrode Voltagerecorder Referenceelectrode
© 2011 Pearson Education, Inc. Hyperpolarization and Depolarization • When gated K+ channels open, K+ diffuses out, making the inside of the cell more negative • This is hyperpolarization, an increase in magnitude of the membrane potential
Figure 48.10 Graded hyperpolarizationsproduced by two stimuli thatincrease membrane permeabilityto K (a) Graded hyperpolarizationsproduced by two stimuli thatincrease membrane permeabilityto Na (b) Action potential triggered by adepolarization that reaches thethreshold (c) Stimulus Strong depolarizing stimulus Stimulus 50 50 50 Actionpotential 0 0 0 Membrane potential (mV) Membrane potential (mV) Membrane potential (mV) Threshold Threshold Threshold 50 50 50 Restingpotential Restingpotential Restingpotential Depolarizations Hyperpolarizations 100 100 100 2 2 2 6 0 1 3 4 5 0 1 3 4 5 0 1 3 4 5 Time (msec) Time (msec) Time (msec)
Figure 48.10a Graded hyperpolarizationsproduced by two stimuli that increase membrane permeability to K (a) Stimulus 50 0 Membrane potential (mV) Threshold 50 Restingpotential Hyperpolarizations 100 0 3 5 1 2 4 Time (msec)
© 2011 Pearson Education, Inc. • Opening other types of ion channels triggers a depolarization, a reduction in the magnitude of the membrane potential • For example, depolarization occurs if gated Na+ channels open and Na+ diffuses into the cell
Figure 48.10b Graded depolarizationsproduced by two stimuli that increase membrane permeability to Na (b) Stimulus 50 0 Membrane potential (mV) Threshold 50 Restingpotential Depolarizations 100 0 3 4 5 1 2 Time (msec)
© 2011 Pearson Education, Inc. Graded Potentials and Action Potentials • Graded potentials are changes in polarization where the magnitude of the change varies with the strength of the stimulus • These are not the nerve signals that travel along axons, but they do have an effect on the generation of nerve signals
© 2011 Pearson Education, Inc. • If a depolarization shifts the membrane potential sufficiently, it results in a massive change in membrane voltage called an action potential • Action potentials have a constant magnitude, are all-or-none, and transmit signals over long distances • They arise because some ion channels are voltage-gated, opening or closing when the membrane potential passes a certain level
Figure 48.10c Action potentialtriggered by adepolarization thatreaches the threshold (c) Strong depolarizing stimulus 50 Actionpotential 0 Membrane potential (mV) Threshold 50 Restingpotential 100 0 3 5 6 4 1 2 Time (msec)
© 2011 Pearson Education, Inc. Generation of Action Potentials: A Closer Look • An action potential can be considered as a series of stages • At resting potential • Most voltage-gated sodium (Na+) channels are closed; most of the voltage-gated potassium (K+) channels are also closed
Figure 48.11-1 1 1 Key Na K 50 0 Membrane potential(mV) Threshold 50 Resting potential 100 Time OUTSIDE OF CELL Sodiumchannel Potassiumchannel INSIDE OF CELL Inactivation loop Resting state
© 2011 Pearson Education, Inc. • When an action potential is generated • Voltage-gated Na+ channels open first and Na+ flows into the cell • During the rising phase, the threshold is crossed, and the membrane potential increases • During the falling phase, voltage-gated Na+ channels become inactivated; voltage-gated K+ channels open, and K+ flows out of the cell
Figure 48.11-2 2 1 1 2 Key Na K 50 0 Membrane potential(mV) Threshold 50 Depolarization Resting potential 100 Time OUTSIDE OF CELL Sodiumchannel Potassiumchannel INSIDE OF CELL Inactivation loop Resting state
Figure 48.11-3 3 2 1 3 1 2 Key Na K Rising phase of the action potential 50 Actionpotential 0 Membrane potential(mV) Threshold 50 Depolarization Resting potential 100 Time OUTSIDE OF CELL Sodiumchannel Potassiumchannel INSIDE OF CELL Inactivation loop Resting state
Figure 48.11-4 4 3 2 1 4 3 1 2 Key Na K Falling phase of the action potential Rising phase of the action potential 50 Actionpotential 0 Membrane potential(mV) Threshold 50 Depolarization Resting potential 100 Time OUTSIDE OF CELL Sodiumchannel Potassiumchannel INSIDE OF CELL Inactivation loop Resting state
© 2011 Pearson Education, Inc. 5. During the undershoot, membrane permeability to K+ is at first higher than at rest, then voltage-gated K+ channels close and resting potential is restored
Figure 48.11-5 1 5 4 3 2 1 5 4 3 1 2 Key Na K Falling phase of the action potential Rising phase of the action potential 50 Actionpotential 0 Membrane potential(mV) Threshold 50 Depolarization Resting potential 100 Time OUTSIDE OF CELL Sodiumchannel Potassiumchannel INSIDE OF CELL Inactivation loop Resting state Undershoot
Figure 48.11a 1 2 3 4 5 1 50 Actionpotential 0 Membrane potential(mV) Threshold 50 Resting potential 100 Time
© 2011 Pearson Education, Inc. • During the refractory period after an action potential, a second action potential cannot be initiated • The refractory period is a result of a temporary inactivation of the Na+ channels
© 2011 Pearson Education, Inc. BioFlix: How Neurons Work