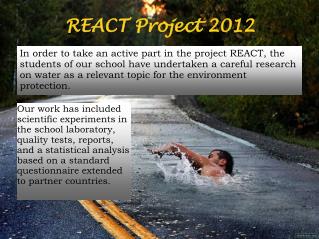
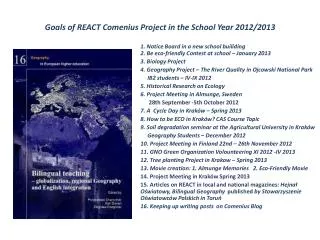
REACT Project 2012
REACT Project 2012. In order to take an active part in the project REACT, the students of our school have undertaken a careful research on water as a relevant topic for the environment protection.

REACT Project 2012
E N D
Presentation Transcript
REACT Project 2012 In order to take an active part in the project REACT, the students of our school have undertaken a careful research on water as a relevant topic for the environment protection. Our work has included scientific experiments in the school laboratory, quality tests, reports, and a statistical analysis based on a standard questionnaire extended to partner countries.
Water: an universal resource Out of a total of 1.4 billion cubic kilometers of water on Earth, 97% is contained in seas and oceans, and men make use of only 1%. However, this percentage is not homogeneous: the most developed countries use a great deal of water, far more than what they need, whereas millions of people don’t have access to water for basic needs. In rich countries most of the drinkable water is dispensed in plastic or glass bottles. Italy, for example, is the third largest consumer of bottled water in the world, and even the first in Europe. Yet, the use of water supplied by public waterworks is widespread. In order to test out the healthiness of the water in the area where we live, we have carried out two experiments in our school laboratory:
Experiment number one : the chemical analysis After buying a special kit, we managed to reproduce the analysis of parameters present in water. According to the law decree number 32 issued in 2001, the substances in water must fall within the following standard values: PH: 6,5 – 9,5 Hardness: 15 -50 °F Nitrates: < 50 mg/l Nitrites: < 0,5 mg/l Chlorides: <250 mg/l Sulfates: <250 mg/l
We dipped strips of paper on which we had put chemical substances into test-tubes containing water. As a result of a specific colorimetric test, we could observe that each strip revealed presence and concentration of all the substances. At the end of our experience we noticed that our water had the required parameters, in accordance with the law. Only hardness exceeds the standard value, but that is going to alter only its flavour, not its being drinkable.
Experiment number two: the bacteriological analysis By means of a chemical compound, the Agar, we created a culture for bacterial growth to which we added tap water in order to test out the presence of bacteria in the water. The mixture was poured into some plates previously sterilized. Bacteria require two-three days and a propitious environment to grow up. Once this time had elapsed, the results obtained were:
- Only one Agar plate showed the growth of some colonies of bacteria. - 4 out of 5 Agar plates did not show any growth of bacteria; Bacteria are supposed to have been born because of an unfulfilling and so unsatisfactory sterilization, due to poor instruments used in the experiment. Yet, for this very reason, we can assume that the water does not contain any bacteria.
We have implemented our project with a range of statistical data obtained through questionnaires from partner countries.From these we can deduce several habits of students from many European states regarding various aspects of water. We will here analyze and compare the obtained data.
Percentages Germany Italy Sweden 17,5% 21,7% 40% 7,2% 6,5% 60% 75,3% 71,8% 7,2% 26,1% 32% 32% 6,5% 60,8% 68% 67,4%
Percentages Netherlands Belgium Finland 2% 59% 24,6% 29% 39% 37% 14,5% 56,5% 38,4% 2,7% 2% 38,7% 50,7% 35% 51,6% 46,6% 63% 9,7%
Marks Italy: Germany: Still= 8,09 Sparkling= 6,24 Waterworks= 6,37 Others= 7,77 Still= 6,16 Sparkling= 7,41 Waterworks= 4,62 Others= 7,71 Netherlands: Sweden: Still= 6,36 Sparkling= 6,84 Waterworks= 6,96 Others= 7,20 Still= 6,98 Sparkling= 3,68 Waterworks= 7,83 Others= 8,78 Belgium: Finland: Still= 6,23 Sparkling= 2,89 Waterworks= 3,89 Others= 6 Still= 7,55 Sparkling= 5,60 Waterworks= 8,79 Others= 7,55
Tap water 44,6% 13% 6,2% 44,33% 55,67% 87% 93,8% 55,4%
Tap water 8% 11% 24,7% 100% 92% 89% 75,3%
Tap water 6,5% 38,7% 4% 16% 96% 84% 93,5% 61,3%
Domestic water systems There are many types of domestic systems which treat water and allow it to be perfectly drinkable. These systems differ in how they work. The most common systems are: REVERSE OSMOSIS WATER SOFTENER TAP FILTER FILTER JUG
Domestic treatments 59,8% 56% 31,5% 44% 40,2% 68,5%
Domestic treatments 37,1% 38,3% 18% 62,9% 61,7% 82%
Which treatments 24,2% 35,7% 40,9% 21% 51,7% 10,3% 35% 64,3% 3,1% 13,8%
Which treatments 7,1% 30,4% 43,5% 39,3% 22% 35,7% 11% 8,5% 3,6% 67% 14,3% 17,6%
This is the point of public distribution of drinking water in Empoli, which is free to use.
![REACT [IST-2005-033607] CAP in the IST project REACT](https://cdn0.slideserve.com/90765/react-ist-2005-033607-cap-in-the-ist-project-react-dt.jpg)


![REACT [IST-2005-033607] CAP in the IST project REACT](https://cdn5.slideserve.com/9383499/react-ist-2005-033607-cap-in-the-ist-project-react-dt.jpg)