Download

1 / 68
680 likes | 826 Vues
Econ 240 C. Lecture 16. Part I. ARCH-M Modeks. In an ARCH-M model, the conditional variance is introduced into the equation for the mean as an explanatory variable. ARCH-M is often used in financial models. Net return to an asset model. Net return to an asset: y(t) y(t) = u(t) + e(t)

E N D
Econ 240 C Lecture 16
Part I. ARCH-M Modeks • In an ARCH-M model, the conditional variance is introduced into the equation for the mean as an explanatory variable. • ARCH-M is often used in financial models
Net return to an asset model • Net return to an asset: y(t) • y(t) = u(t) + e(t) • where u(t) is is the expected risk premium • e(t) is the asset specific shock • the expected risk premium: u(t) • u(t) = a + b*h(t) • h(t) is the conditional variance • Combining, we obtain: • y(t) = a + b*h(t) +e(t)
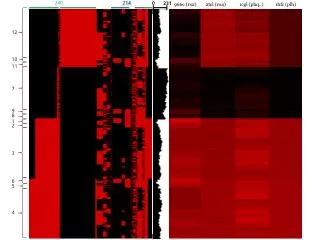
Northern Telecom And Toronto Stock Exchange • Nortel and TSE monthly rates of return on the stock and the market, respectively • Keller and Warrack, 6th ed. Xm 18-06 data file • We used a similar file for GE and S_P_Index01 last Fall in Lab 6 of Econ 240C
Try Adding the Conditional Variance to the Returns Model • PROCS: Make GARCH variance series: GARCH01 series
Part II. Granger Causality • Granger causality is based on the notion of the past causing the present • example: Lab six, Index of Consumer Sentiment January 1978 - March 2003 and S&P500 total return, montly January 1970 - March 2003
Time Series are Evolutionary • Take logarithms and first difference
Dlncon’s dependence on its past • dlncon(t) = a + b*dlncon(t-1) + c*dlncon(t-2) + d*dlncon(t-3) + resid(t)
Dlncon’s dependence on its past and dlnsp’s past • dlncon(t) = a + b*dlncon(t-1) + c*dlncon(t-2) + d*dlncon(t-3) + e*dlnsp(t-1) + f*dlnsp(t-2) + g* dlnsp(t-3) + resid(t)
Do lagged dlnsp terms add to the explained variance? • F3, 292 = {[ssr(eq. 1) - ssr(eq. 2)]/3}/[ssr(eq. 2)/n-7] • F3, 292 = {[0.642038 - 0.575445]/3}/0.575445/292 • F3, 292 = 11.26 • critical value at 5% level for F(3, infinity) = 2.60
Causality goes from dlnsp to dlncon • EVIEWS Granger Causality Test • open dlncon and dlnsp • go to VIEW menu and select Granger Causality • choose the number of lags
Does the causality go the other way, from dlncon to dlnsp? • dlnsp(t) = a + b*dlnsp(t-1) + c*dlnsp(t-2) + d* dlnsp(t-3) + resid(t)
Dlnsp’s dependence on its past and dlncon’s past • dlnsp(t) = a + b*dlnsp(t-1) + c*dlnsp(t-2) + d* dlnsp(t-3) + e*dlncon(t-1) + f*dlncon(t-2) + g*dlncon(t-3) + resid(t)
Do lagged dlncon terms add to the explained variance? • F3, 292 = {[ssr(eq. 1) - ssr(eq. 2)]/3}/[ssr(eq. 2)/n-7] • F3, 292 = {[0.609075 - 0.606715]/3}/0.606715/292 • F3, 292 = 0.379 • critical value at 5% level for F(3, infinity) = 2.60
Granger Causality and Cross-Correlation • One-way causality from dlnsp to dlncon reinforces the results inferred from the cross-correlation function
Part III. Simultaneous Equations and Identification • Lecture 2, Section I Econ 240C Spring 2003 • Sometimes in microeconomics it is possible to identify, for example, supply and demand, if there are exogenous variables that cause the curves to shift, such as weather (rainfall) for supply and income for demand
Dependence of price on quantity and vice versa price demand quantity
Shift in demand with increased income price demand quantity
Dependence of price on quantity and vice versa price supply quantity
Simultaneity • There are two relations that show the dependence of price on quantity and vice versa • demand: p = a - b*q +c*y + ep • supply: q= d + e*p + f*w + eq
Endogeneity • Price and quantity are mutually determined by demand and supply, i.e. determined internal to the model, hence the name endogenous variables • income and weather are presumed determined outside the model, hence the name exogenous variables
Shift in supply with increased rainfall price supply quantity
Identification • Suppose income is increasing but weather is staying the same
Shift in demand with increased income, may trace out i.e. identify or reveal the demand curve price supply demand quantity
Shift in demand with increased income, may trace out i.e. identify or reveal the supply curve price supply quantity