Download
1 / 2
20 likes | 117 Vues
Time under UV Lamp (seconds). Mombo1/307 Transduction. 1μL Mombo1/AgSa Lysate. 100μL Mombo1/AgSa Lysate. Dilution. Number of Colonies. Transduction. Plate. Number of Colonies. -1. 4 Bdello. 0. No growth. contaminant. 1. -1. contaminants. -2. No growth. 15. No growth.

E N D
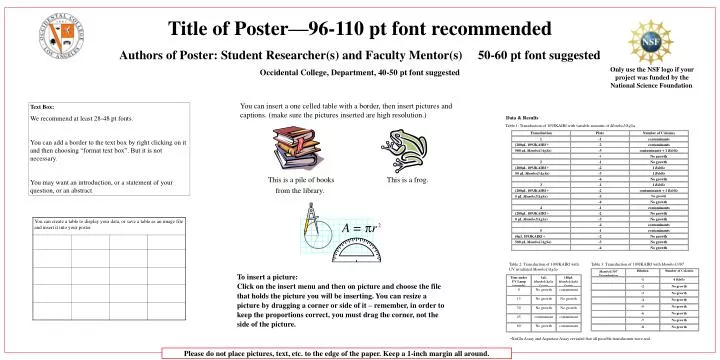
Time under UV Lamp (seconds) Mombo1/307Transduction 1μL Mombo1/AgSa Lysate 100μL Mombo1/AgSa Lysate Dilution Number of Colonies Transduction Plate Number of Colonies -1 4 Bdello 0 No growth contaminant 1 -1 contaminants -2 No growth 15 No growth No growth (200μL 109JKAIRf + -2 contaminants -3 No growth 30 No growth No growth 500 μL Mombo1/AgSa) -3 contaminants + 1 Bdello -4 No growth 45 contaminant contaminant -4 No growth -5 No growth 60 No growth contaminant 2 -1 No growth -6 No growth (200μL 109JKAIRf + -2 1 Bdello -7 No growth 50 μL Mombo1/AgSa) -3 1 Bdello -8 No growth -4 No growth 3 -1 1 Bdello (200μL 109JKAIRf + -2 contaminants + 1 Bdello 5 μL Mombo1/AgSa) -3 No growth -4 No growth 4 -1 contaminants (200μL 109JKAIRf + -2 No growth 0 μL Mombo1/AgSa) -3 No growth -4 contaminants 5 -1 contaminants (0μL 109JKAIRf + -2 No growth 500 μL Mombo1/AgSa) -3 No growth -4 No growth Title of Poster—96-110 pt font recommended Authors of Poster: Student Researcher(s) and Faculty Mentor(s) 50-60 pt font suggested Occidental College, Department, 40-50 pt font suggested Only use the NSF logo if your project was funded by the National Science Foundation. Text Box: We recommend at least 28-48 pt fonts. You can add a border to the text box by right clicking on it and then choosing “format text box”. But it is not necessary. You may want an introduction, or a statement of your question, or an abstract. Data & Results Table 1: Transduction of 109JKAIRf with variable amounts of Mombo1/AgSa Table 2: Transduction of 109JKAIRf with UV irradiated Mombo1/AgSa Table 3: Transduction of 109JKAIRf with Mombo1/307 • XαGlu Assay and Aspartase Assay revealed that all possible transducants were real. Please do not place pictures, text, etc. to the edge of the paper. Keep a 1-inch margin all around.
Mombo1/307Transduction Time under UV Lamp (seconds) 1μL Mombo1/AgSa Lysate 100μL Mombo1/AgSa Lysate Dilution Number of Colonies Transduction Plate Number of Colonies -1 4 Bdello 0 No growth contaminant 1 -1 contaminants -2 No growth 15 No growth No growth (200μL 109JKAIRf + -2 contaminants -3 No growth 30 No growth No growth 500 μL Mombo1/AgSa) -3 contaminants + 1 Bdello -4 No growth 45 contaminant contaminant -4 No growth -5 No growth 60 No growth contaminant 2 -1 No growth -6 No growth (200μL 109JKAIRf + -2 1 Bdello -7 No growth 50 μL Mombo1/AgSa) -3 1 Bdello -8 No growth -4 No growth 3 -1 1 Bdello (200μL 109JKAIRf + -2 contaminants + 1 Bdello 5 μL Mombo1/AgSa) -3 No growth -4 No growth 4 -1 contaminants (200μL 109JKAIRf + -2 No growth 0 μL Mombo1/AgSa) -3 No growth -4 contaminants 5 -1 contaminants (0μL 109JKAIRf + -2 No growth 500 μL Mombo1/AgSa) -3 No growth -4 No growth To insert and format a chart: Click on the insert chart button, the one that looks like a bar graph, or go to the insert menu and choose chart. PowerPoint automatically opens a standard set of options – a datasheet and a chart. When it does this, right click on the picture of the one that is most similar to what you have in mind and select chart type, then select the type of chart you would like to make. Enter your data as appropriate into the data table provided. You may have to rearrange your data to fit the form that the program expects. You can paste in data from another source, such as Excel, but you may have to reformat the data depending upon the type of chart you are trying to create – for example, your data might be in rows and you need to have columns. Usually right clicking on the part you need to edit will allow you to do so. To change colors on your chart you must change the Slide Color Scheme. To do this, click on the Format menu and select Slide Color Scheme from it. That will open a new window. In that window select the custom tab. To change the colors, simply click on the color you would like to change and then click the change color button and choose your color. To insert a data table: Use the button with the X on it (just to the left of the chart button) and then select your table size. Note: You can later change the table size. The table will show up initially looking much like an Excel table and editing it works just about the same, using right clicks to get to the editing functions. You can change the size of your table (which will add or remove cells) by dragging the small black boxes on each side or on the corner. Note: the gray cell lines WILL print on your document. Data & Results Table 1: Transduction of 109JKAIRf with variable amounts of Mombo1/AgSa To insert text: Click on the insert menu and then on the text box. The cursor then looks like a sword. Choose where you want the upper left corner of the box to be and then click and drag. The box will only be one line big until you put your text into it and it will expand to meet the size of your text. Alternatively, you can paste in text from Word. You can also change the size, font, color, etc of your text by selecting the text you want to edit and going to the format menu, then click on font. Table 3: Transduction of 109JKAIRf with Mombo1/307 Table 2: Transduction of 109JKAIRf with UV irradiated Mombo1/AgSa • XαGlu Assay and Aspartase Assay revealed that all possible transducants were real. Acknowledgements: Please remember to thank the funding sources for your research. Support for this project was provided by a fellowship from a Howard Hughes Medical Institute Undergraduate Science Education Grant and the Undergraduate Research Center.


![Title [40 font, bold] Authors [18 font] Department Name, College of Health Professions [14 font]](https://cdn2.slideserve.com/4118224/slide1-dt.jpg)


![[Title] Title of your poster: Specific title of your poster](https://cdn3.slideserve.com/6387104/slide1-dt.jpg)