Methodology for Extracting Acoustics Data on Fish Populations Across Northern European Regions
This document outlines the methodology used for extracting and analyzing acoustics data related to fish populations, specifically herring and sprat, across various northern European regions, including Denmark, Germany, the Netherlands, and Norway. The approach involves grouping and summarizing haul data based on geographical proximity and cumulative length-frequency distributions. The paper emphasizes the importance of considering length and age distributions when calculating mean weights, and includes detailed descriptions of standardization procedures for trawl catches and data integration across different regions.

Methodology for Extracting Acoustics Data on Fish Populations Across Northern European Regions
E N D
Presentation Transcript
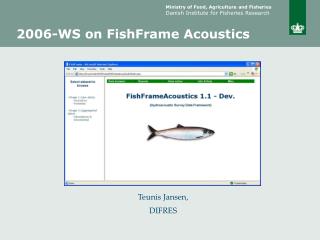
2006-WS on FishFrame Acoustics Extraction of methodology descriptions Teunis Jansen Danish Institute for Fisheries Research
Regions and combination of trawls • Nederland: • “We make a graph with the cumulative distributions of all hauls and group them by eyeball on the basis of their geographical closeness and similarity in the cumulative LF distribution. Hauls with less than 20 herrings (or sprat) and specimens of less than 6 cm are disregarded”. • Germany: • Region = rectangle • “the number of all herring in all 60min-standardised hauls of the rectangle are added and the same is done for sprat.” • Remember the length distribution when calculating the mean weight at age “The total numbers per length&age&maturity-class per rectangle (from 3.6) are now summed up over the rectangles of the whole area of investigation and these sums are then multiplied with the appropriate mean weight for each length&age&maturity-class. The resulting total weights per length&age&maturity-class are the summed up for each age&maturity-class and divided by the total number of herrings in this age&maturity-class. The result is the mean weight of a single herring in each age&maturity-class that takes account of the (often skewed) length distribution of this class.” • Norway: “The “regions” used are ICES sq.” • Denmark: • Regions: Based on an extensive study in the early 80ies. • “Mean haul per stratum calculated as a weighted mean after all hauls has been normalised to 60 min hauls” • BIAS: • “Trawl catches within each ICES rectangle are combined to give an average species composition of the catch.” And “…each trawl catch is given equal weight. ” • Region = Rectangle for Length distrib. • Region = “Rectangle” for Age and mean weigth (max effort) • Region = “Sub-Division” for Age and mean weigth (min effort)
Abundance • Nederland: • on raising densities to abundance in total area: “for rectangles with land, we apply a coastal factor based on “experience””. • Germany: • “<> = const. * <L²>” (same as when b = 20 which it is so far for all relevant species). • Denmark: • “By use of mean TS per stratum are number of ”mean” fish calculated by stratum”. Is “mean TS” really meaning “mean cross section ”. How is it calculated? • BIAS: • Check 5.9 “This total abundance is split into species classes Ni by Ni = N * fi (5.9.2)
Unsampled strata • Germany: • Rectangles for which sufficient echo-acoustic information exists but that have not been sampled with the net are interpolated using the biological data from the neighbouring rectangles. • Detailed description in chapter 4. • Denmark: • No holes. Only 6 regions. • BIAS: • “…mean of all available neighboring rectangles “