Download
1 / 28
280 likes | 574 Vues
Human Population - Some Supplements (Chapter 5 & 8). Brief History of Human Migration & Population Increase Currently, Explosive Factors that affect population growth How to Control. Guangzhou, China. Case study: China’s one-child policy.

E N D
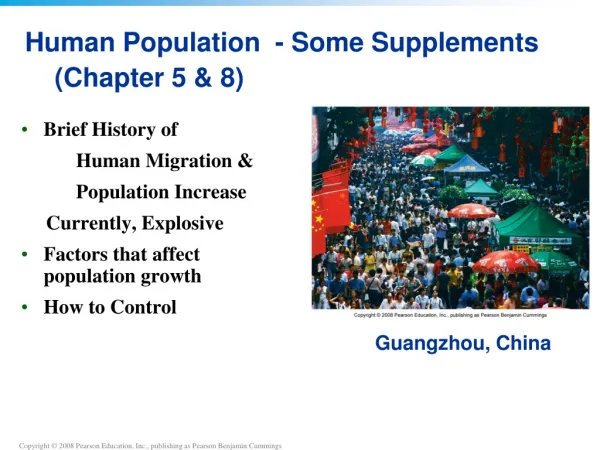
Human Population - Some Supplements (Chapter 5 & 8) • Brief History of Human Migration & Population Increase Currently, Explosive • Factors that affect population growth • How to Control Guangzhou, China
Case study: China’s one-child policy • In 1970, China’s 790 million people faced starvation • The government instituted a one-child policy • China’s growth rate plummeted • In 1984, the policy exempted ethnic minorities and farmers • Unintended consequences: killing female infants and a black-market trade in teenage girls
The human population is still growing rapidly • It took all of human history (~200,000 yrs) to reach 1 billion • In 1930, 130 years later, we reached 2 billion, and added the most recent billion in 12 years Due to exponential growth, even if the growth rate remains steady, population will continue to grow
Rates of growth vary from region to region • At today’s 1.2% global growth rate, the population will double in 58 years (70/1.2 = 58) • If China’s rate continued at 2.8%, it would have had 2 billion people in 2004.
Is population growth really a problem? • Population growth results from technology, sanitation, food • Death rates drop, but not birth rates • Some people say growth is no problem • New resources will replace depleted ones • But, some resources (i.e., biodiversity) are irreplaceable • Quality of life will suffer with unchecked growth • Less food, space, wealth per person
Population growth affects the environment • The IPAT model: I = P x A x T x S • Our total impact (I) on the environment results from the interaction of population (P), affluence (A) and technology (T), with an added sensitivity (S) factor • Population = individuals need space and resources • Affluence = greater per capita resource use • Technology = increased exploitation of resources • Sensitivity = how sensitive an area is to human pressure • Further model refinements include education, laws, ethics Humanity uses 1/3 of all the Earth’s net primary production
Computer simulations predict the future • Simulations project trends in population, food, pollution, and resource availability • If the world does not change, population and production will suddenly decrease • In a sustainable world, population levels off, production and resources stabilize, and pollution declines
Demography • All population principles apply to humans • Environmental factors limit population growth • Humans can raise the environment’s carrying capacity through technology • How many humans can the world sustain? 1 – 33 billion • Population growth can’t continue forever
Population growth depends on various factors • Whether a population grows, shrinks, or remains stable depends on: • Rates of birth, death, and migration • Birth and immigration add individuals • Death and emigration remove individuals • Technological advances led to dramatic decline in human death rates • Widening the gap between birth rates and death rates resulting in population expansion
Factors affecting total fertility rate • Total fertility rate (TFR) = the average number of children born per female • Replacement fertility = TFR that keeps the size of a population stable • Increasing urbanization decreases TFR • Children go to school, and increase costs • With social security, elderly parents need fewer children to support them • Greater education allows women to enter the labor force, with less emphasis on child rearing
Life expectancy is increasing • Natural rate of population change = due to birth and death rates alone • In countries with good sanitation, health care, and food, people live longer • Life expectancy = average number of years that an individual is likely to continue to live • Increased due to reduced rates of infant mortality • Urbanization, industrialization, and personal wealth
The demographic transition • Demographic transition = a model of economic and cultural change to explain the declining death and birth rates in industrializing nations • Stable preindustrial state of high birth and death rates change to a stable post-industrial state of low birth and death rates • As mortality decreases, there is less need for large families • Parents invest in quality of life
The demographic transition’s four stages Population growth is seen as a temporary phenomenon
Fertility rates drop when women gain access to contraceptives, family planning programs and better educational opportunities In 2007, 54% of married women worldwide used contraception; China = 86%; the U.S. = 68%; 20 African nations < 10% Empowering women reduces growth rates Women with little power have unintended pregnancies
Population policies and family planning work • Many countries provide incentives, education, contraception, and reproductive health care • Funding and policies that encourage family planning lower population growth rates in all nations • Thailand has an educational based approach to family planning and its growth rate fell from 2.3% to 0.7% • Brazil, Mexico, Iran, Cuba, and other developing countries have active programs
The International Conference on Population and Development • In 1994 Cairo, Egypt, 179 nations called on all governments to offer universal access to reproductive health care within 20 years • Offer better education and health care and alleviate poverty, disease, and sexism • Despite the success of family planning, recent Republican administrations in the U.S. have declined to fund family-planning efforts • George W. Bush cancelled funding as one of his first acts on becoming U.S. president in 2001
Poorer societies have higher growth rates than wealthier societies Consistent with the demographic transition theory They have higher fertility and growth rates, with lower contraceptive use Poverty and population growth are correlated 99% of the next billion people added will be born in poor, less developed regions that are least able to support them
Conclusion • The human population is larger than at any time in the past • Populations are still rising, even with decreasing growth rates • Most developed nations have passed through the demographic transition • Expanding rights for women slows population growth • Will the population stop rising through the demographic transition, restrictive governmental intervention, or disease and social conflict caused by overcrowding and competition? • Sustainability requires a stabilized population in time to avoid destroying natural systems
QUESTION: Review What has accounted for the majority of the world’s population growth in recent years? a) Women are having more babies b) Death rates have dropped due to technology, medicine, and food c) More women are using contraceptives d) Nothing, the population has dropped in recent years
QUESTION: Review According to the I = P x A x T formula, what would happen if China’s 1 billion people had a lifestyle like Americans? a) Their population would automatically drop b) Their population would automatically increase c) Their affluence and technology would increase d) Their impact on the environment would even out
QUESTION: Review How have humans been able to raise the environment’s carrying capacity for our species? a) Through technology b) By eliminating limiting factors c) Through increased consumption d) Spending more money on non-essential resources
QUESTION: Review Areas that lack significant numbers of people, and have a low population density are… a)No longer available b) Best able to support higher densities of people c) Sensitive areas least able to support high densities of people d) Located around tropical and grassland areas
QUESTION: Review Describe the relationship between growth rates and population size. a) Falling growth rates automatically mean a smaller population b) Falling growth rates automatically mean a larger population c) Falling growth rates means we no longer have a population problem d) Falling growth rates does not mean a smaller population, but that rates of increase are slowing
QUESTION: Weighing the Issues In 2001 the Bush administration withheld funds for international family planning. Should the U.S. fund family planning? a)Yes, absolutely b) Yes, but only in nations that follow U.S.-approved programs c) Only if it can influence the nations’ policies d) Never under any circumstances, it’s not our job
QUESTION: Weighing the Issues Would you rather live in a country with a larger population or smaller population? a) Small population, so there will be more resources for me b) Small population, so there will be more resources for others, including wildlife c) Large population, so I can find a date d) Large population, because people are our biggest resource
QUESTION: Interpreting Graphs and Data What happens during the “pre-industrial” stage of the demographic transition? • High birth and death rates rise cause population increases • High birth and death rates, but population is stable • High birth rates with low death rates cause population to increase • Low birth and death rates cause the population to decrease
QUESTION: Interpreting Graphs and Data a) Balanced b) Larger c) Much larger Smaller Much smaller According to this age pyramid, Madagascar’s future population will be…?
QUESTION: Interpreting Graphs and Data a) Iraq and Pakistan b) Malawi and Haiti c) Malawi and Kenya Kenya and Bangladesh According to these graphs, which countries had access to family planning?


