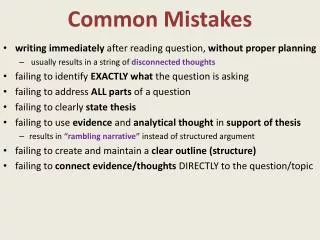
Common Mistakes in Classroom Research Papers
460 likes | 549 Vues
Learn essential strategies to improve your classroom research papers and avoid common pitfalls pointed out by journal referees. Understand the importance of clear logic, thorough data description, and presenting results effectively.

Common Mistakes in Classroom Research Papers
E N D
Presentation Transcript
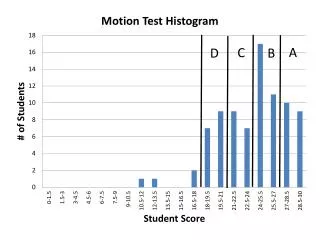
I have looked quickly through your paper. I can guess what the referees are going to say. They will complain that you have thrown away information by using letter grades instead of using actual exam scores. They will complain that you have not exploited the fact that each student wrote both a macro and a micro exam. They will complain that the scores on the two exams are not standardized in some way to allow you to compare them. They will complain that in some categories there are very few observations. They will complain that you have dodged the possible selection bias problem rather than argued for why it is not a problem. They will complain that in half your data a different instructor taught micro versus macro, rendering suspicious a comparison of micro and macro grades.
Common Mistakes Made in Classroom Research Your paper has been sent to me for processing for the JEE. In fairness to both authors and referees, it is my policy not to send out for review papers which appear to be such that referees would reject them outright or require major revisions and more extensive refereeing. Your paper falls in this category.
What is classroom research? Using data gathered from your students to investigate interesting issues in economic education. Examples: One minute paper; Selective grading; Using the Web; MC vs CR; Seating location; Attendance
1. Submit a clean copy “You have sent me a version that has tracked editorial changes marked in red. I think you should send me a clean version for the referees.”
“Put the Andreoni and Miller reference in the bibliography. Your whole paper revolves around this publication; referees will want to know where to find it. And check that your other references are there; if one is missed often others are also missed.”
2. Don’t be enigmatic “You need to provide in the abstract a hint of what is the SRQ measure.”
3. Describe the logic of your study clearly “The referees had a difficult time reading the paper. I had the same problem. I also had great difficulty figuring out just what is the contribution of this paper and how you have done it. Here is what I eventually figured out….”
4. Survey the education literature “I don’t know of any papers in the economic education literature that examine this or related issues, but I find it hard to believe that there are no such studies in the education literature.”
5. Provide important institutional details “What is the definition of cheating in your school’s honor code?” “State explicitly that your university does not use plus/minus grading.” “Is it really true at your school that students can take micro principles and intermediate micro at the same time?”
6. Describe the context fully “You need a better description of how control and treatment groups were determined. How do we know that the control groups weren’t all night classes, for example? Why is one control group so small?” “The main problem with this paper is that there is very little information on exactly how the control classes are different.”
“You need to say more about the character of the courses. Was instruction based on using graphs, or were graphs for the most part eschewed? Did the instructor derive graphs or just use them as pictorial aids? Were problems analyzed by shifting curves on graphs or via logical stories? Did the exam questions involve graphs or could the questions be answered without knowing the graphical details? Were the textbooks graph-oriented?”
7. Describe your data adequately “Readers have to guess at the meaning of the explanatory variables listed in Table 2. There is no clean explanation of the auditorium variable, for example, an important omission given that it plays a prominent role in the empirical results.” “I can’t tell how many students were in each of the classes.”
8. Report summary statistics for both groups and present a simple comparison of means “As a prelude to presenting the regression results I think you should a) report the characteristics of the treatment and control classes and discuss if they are reasonably similar; and b) compare the two groups’ average scores.”
“Table 1 does not show the control and treatment figures separately, a key omission. Using such numbers perhaps you could argue that the students were assigned "randomly" to the two formats, allowing a simple comparison of average scores rather than having to rely on regression analysis with its attendant specification uncertainties (illustrated dramatically by your spectacularly different coefficient estimates for male versus female - most referees would conclude that the results lack credibility).”
9. Get the tables right “Consolidate your tables. You don't need to report both t values and standard errors; just report the former, and put them in parentheses under the slope estimates. This should free up columns for other results to be reported in the same table.”
10. Be consistent “If you believe that the relationship between effort and exam scores is given by figure 1, why are you using a linear functional form?” “You say you get these measures from a student survey but then talk about some of them coming from actual measurements.”
11. Include an ability variable “A very unusual thing about this study is that it does not have a measure of student ability. There is a lot of empirical evidence that once student ability is accounted for, nothing else is of consequence. Referees will claim that your innovative measure is simply proxying for the missing ability variable.”
12. Create a Fair Comparison “I don’t see an explanation of what the control group did with the extra time it had by not doing the active learning. Presumably they spent this time working on the issues learned in the active learning exercises, but silence on this makes me suspect that very little effort was made to ensure that the comparison between the two classes was fair in this regard.”
13. Don’t ignore important issues “I don’t see any discussion of the selection bias that may arise because you do not have data on all students.” “You need to explain/defend why you are ignoring possible endogeneity of SETs and grades.”
14. Don’t try to do too much “I find it very difficult to read this paper because I am swamped with numbers, most of which relate to issues other than the main point of the paper. Narrow the paper to focus on the results that you think are the strongest and most interesting.”
15. Spell things out “I can’t figure out what is the base category. The interpretation of the ‘percentage of class time lecturing’ depends on the base category - if there is a higher percentage of lecturing there must be a lower percentage of something else.”
16. Use an appropriate estimator “It looks to me as though none of the data are at the limit, so I don’t think the Tobit estimation procedure is relevant here.” “Because these are class average data, there is known heteroskedasticity; you should correct for this.”
“It looks to me as though there is an excessive number of zeros here, in which case you should be testing for overdispersion and probably using a ZIP model rather than a Poisson model.”
17. Explain econometrics understandably “I have read over your revision, but unfortunately I still don’t understand what you are doing. One of my rules of thumb is that if I can’t understand it I can’t expect referees to understand it. And I certainly can’t expect JEE readers to understand it. You need to explain the logic of what you are doing; the current exposition is just a bunch of equations.”
18. Explain econometrics judiciously “Ordered logit is a common technique, so you don’t need two pages of equations describing it.” “Although you don’t need to describe the Hausman test, you do need to explain what instruments you used, and to report the test statistic and its p value.”
19. Don’t make elementary econometric errors “It does not make sense here to put in the interaction term without putting in the interacting terms separately” • “It doesn’t make sense to use a variable measured on a Likert scale as though it is an ordinary explanatory variable – you need to replace it with dummies.”
“The ‘filtering’ method you describe creates biased estimates, as is well-known. I don't think you should use this method.” “On p.5 you talk of doing fixed effects estimation, but in your equations you are putting in a dummy for school which is very different from fixed effects which would put in a dummy for the individual.” “Spell out for my benefit just how you are calculating these standard errors.”
20. Don’t automatically omit variables with small t values “Keep everything that theory says for sure is relevant; only drop variables if they have both low t values and small coefficients; use a much higher p value than 5% (say, 30%) to reduce type II errors. Report your full regression results in addition to the specification you believe is best.”
21. Don’t report irrelevant results “Please refrain from reporting things like the Durbin Watson statistic which is meaningless in this context.”
22. Don’t present unreasonable results “Your empirical results are the most unusual I have ever seen. I’m wondering if it is because the four temperment dummies sum to one and so are perfectly collinear with the intercept except that there is a data error which prevents the collinearity from being perfect? I suggest you do some detective work and sort this out.”
23. Report proper effect sizes “How are you measuring strength of influence last par. on p.11? The coefficient by itself? Or the coefficient times the standard deviation of the explanatory variable? The latter would be much better.”
24. Don’t fall into the significance trap “In light of your large sample size and the large number of specifications you run, I think you should be using a much larger t value before you conclude significance. I would use at least three. More importantly, I would couple this with a subjectively-determined ‘big enough to be important’ coefficient value before concluding that a result warrants being of note.”
25. Do a sensitivity analysis “In the spirit of sensitivity analysis I think you should report whether your results are qualitatively similar when different ability measures are used as independent variables, or different scores are used for the dependent variable, or different functional forms are employed.”
“With your very large sample size, I think you have some scope for homogenizing your data by judiciously selecting subsets of the data and seeing if the results are qualitatively similar. For example, try looking at white sophomores and juniors, taking the course because it is required, with English as a native language, who did not have economics at another college, who have not previously taken micro, and who don’t attend infrequently or rarely. You can probably get reasonably large data sets in this way, for which specification problems are less damaging.”
26. Beware of sample selection “You can’t just compare the distance education student scores with the regular student scores, because the distance students have chosen to be distance students, and so may have some unobserved characteristics that cause them to better or worse than the regular students.”
“If the treatment group instructors were chosen on merit, you can’t conclude that their students did better because of the treatment their instructors received – it could be because their instructors were better, as evidenced by the fact that they were selected for the treatment.” “There is a major dilemma here: Better students (in unobserved ways) may choose to attend more frequently, so we would expect them to score better.”
“It seems to me that the fact that the students were allowed to choose their grading system is a fatal flaw in this study. Better to have had an entire class forced to have plus/minus grading, and another class forced to have straight grading, with both classes writing identical exams. Then you have a clean experiment. With students choosing their grading system you have selection bias – your empirical results may be reflecting the student choice, not motivation.”
“You need to focus on the students who ended up sitting at the front of the class when they preferred to sit at the back of the class. These observations can allow you to overcome the selection bias that otherwise plagues these data.”
27. Use sound logic “You can’t draw the conclusions you are drawing because the control and experimental sections were taught by different instructors. Worse still, you, someone keen on the experimental approach, taught the experimental section. How can we conclude from these results that students of an ordinary prof would benefit from this approach?”
“Here is the essence of what you are doing. You regress student grade in intermediate theory on their principles grade and whether they took principles at a community college. You interpret the negative coefficient on the community college dummy as evidence that community college instructors are not as good as university instructors. I interpret it to mean that community college instructors are more generous with grades than university instructors.”
“It doesn’t seem to me to be possible to compare students’ knowledge across tests because we have no assurance that these tests are comparable. The poorer performance on the economics test may be because the economics test was a more difficult test, not because students don’t know their economics as well as they know material from these other disciplines.”
“Your results say that after controlling for GPA the dummy for private high school students is insignificant. But you can't conclude that private schools are not of value to students. Maybe going to a private school improves a student’s academic skills so that s/he is able to achieve a higher GPA; by controlling for GPA you miss this. You need to use an ability variable that is measured prior to going to high school.”
“It looks to me as though the exams are different between control and treatment; if so, how can you possibly conclude that the difference in scores is due to the treatment?”
What I Wish Studies relevant to economics! Micro before macro? Are graphs worth it? Is teaching velocity a good idea? How to teach international?
Why do I do it? Summary Use good judgment