Download
1 / 18
180 likes | 319 Vues
Property- V alue Movement in Old North Durham. By Katerina Valtcheva. Old North Durham - Overview. Developed with the construction of tobacco warehouses and related commercials and industrial ventures Considered a bad area despite proximity to CBD

E N D
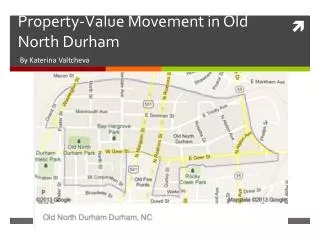
Property-Value Movement in Old North Durham By Katerina Valtcheva
Old North Durham - Overview • Developed with the construction of tobacco warehouses and related commercials and industrial ventures • Considered a bad area despite proximity to CBD • Farmers market, North Durham Elementary School have had some effect on the area • Hypothesis: Recent commercial upturn has had a positive impact on the area (Fullsteam Brewery, Motorco Music Hall, Geer Street Garden, CocoaCinnamon)
Old North Durham - Data • Forty house values collected annually for the first month of each year starting in Jan 2006 and ending in Jan 2013 (Zillow estimates) • Houses located on: W Geer St., North St., Hargrove St., Glendale Ave, Northwood Cir, and N Mangum St. • Built between 1910 and 2004 • Average house size: 1375 ft2 (± 523 ft2) • Average lot size: 6121 ft2 (±1640 ft2) • Average year built: 1937 (±20 years)
Why this area as a control? • Similarly industrial: historical roots in milling and textiles • Similar houses, built around the same time period • Approximately the same distance from CBD • Also economically depressed area
East Durham and Edgemont - Data • Houses located on: Hart St., S Driver St., Roberson St., Angier Ave, Vale St., S Plum St., E Main St., Clay St., and Ashe St. • Built between 1900 and 1992 • Average home size: 1432 ft2 (±476 ft2) • Average lot size: 7047 ft2 (±1413 ft2) • Averages year built: 1929 (± 21 years)
Findings - Continued • Difference between the slopes of the best-fitting line: 0.0113 in favor of the control area
Findings - Continued • Old North Durham: with the addition of data points through 2013, the slope of the price curve falls from .0206 to .0108 • East Durham/Edgemont: the slope of the line describing the overall trend of house prices went from positive .0319 (between 2006-2010) to negative .0275 (when data points are included through 2013)
Statistically Significant Differences • Running a Student’s t test comparing mean home prices on a year-by-year basis: the difference in mean home values between the two neighborhoods was statistically significant from 2010(p<<0.001)
Running Multivariable Regressions on House Size, Lot Size, and Year Built
Running Multivariable Regressions on House Size, Lot Size, and Year Built
Running Multivariable Regressions on House Size, Lot Size, and Year Built