Download
1 / 13
130 likes | 259 Vues
This document summarizes the discussions from the SPARC Temperature Trends Panel meeting held from July 19-21, 2006, in Abingdon. It covers various datasets used for analyzing long-term temperature trends, including radiosonde and rocketsonde data, as well as reanalysis considerations. The meeting focused on summarizing published results and identifying potential new calculations and insights. Key topics discussed include the effects of homogeneity adjustments on trends, time-segmented trends, volcanic signal details, and statistical issues related to temperature datasets.

E N D
Longer-Term Trends Dian Seidel SPARC Temperature Trends Panel Meeting 19-21 July 2006 Abingdon
Outline • Datasets • Considerations for our paper • Recently published results • Possible approaches for our paper
Datasets • Radiosonde • Rocketsonde (Chantal?) • Berlin Analysis (Ulrike) • Reanalysis (not considering)
Considerations • Summarize published results and/or make new calculations? • What can we learn (or report) that we didn’t know circa Ramaswamy et al. (Rev. Geophys. 2001)? • Effect of homogeneity adjustments on trends (Lanzante et al. 2003; Free et al., JGR 2005; Thorne et al., JGR 2005; CCSP 2006) • Time-segmented trends (Seidel and Lanzante, JGR 2004; Ramaswamy et al., Science 2006) • Details of volcanic signal (Free and Angell, JGR 2002; Santer et al., JGR 2001; above studies) • Statistical issues (Nishizawa and Yoden, JGR 2005) • Use only homogeneity-adjusted datasets?
Radiosonde Datasets 1958-present(Update of 3/2005 Reading Report) • Hadley Atmospheric Temperature (HadAT) • UK Met Office (Thorne et al. JGR 2005) • 9 levels, including 300, 200, 150, 100, 50, and 30hPa • Gridded product • Adjustments based on Lanzante et al. (2003) and neighbor comparisons • Available now at http://hadobs.metoffice.com/hadat/ • Radiosonde Atmospheric Temperature Products for Assessing Climate (RATPAC) • NOAA (Free et al. JGR 2005) • 16 levels, including 300, 250, 200, 150, 100, 70, 50 and 30 hPa • Two datasets: • Large-scale (~30 deg bands) anomaly time series based on Lanzante et al. (2003) adjustments through 1979, then first-difference method and metadata • Station data with no adjustments post-1979, also 10-deg zonal data • Available now at http://www.ncdc.noaa.gov/oa/cab/ratpac/index.php
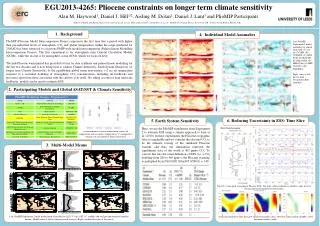
RATPAC and HadAT Coverage Source: CCSP report
Source: CCSP report Note great discrepancy between datasets in early years – RATPAC more variable, with larger Agung signal.
Temperature Trends in the Lower Atmosphere For further information on CCSP Synthesis and Assessment Product 1.1 http://www.climatescience.gov/
Note good agreement between sonde (and surface) datasets compared with satellite.
Possible Approaches • No discussion of pre-satellite errors • Pro: keeps paper shorter and more focused • Con: ignores developments with sonde data • Text-only review of recent literature • Pro: addresses new developments without adding much length • Con: doesn’t allow presentation of new analysis • Text-with-figure(s) presentation of some pre-1979 observations • Pro: most thorough approach • Cons: longer paper, more work