Download
1 / 36
360 likes | 540 Vues
Purified Water Coolers . The Business The Market The future. Presented By: Robin Householder Vice President Pure Health Solutions Inc. Setting Course ( Establishing a POU strategy). Are you ready? Have you started? How does it fit your business plan? Can you afford not too?.

E N D
Purified Water Coolers The Business The Market The future Presented By: Robin Householder Vice President Pure Health Solutions Inc.
Setting Course(Establishing a POU strategy) • Are you ready? • Have you started? • How does it fit your business plan? • Can you afford not too?
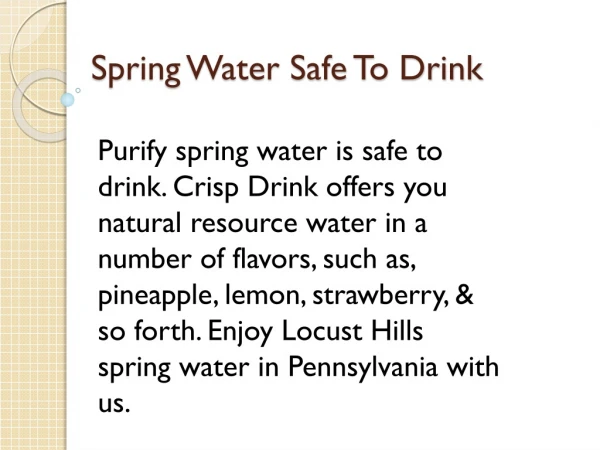
A Survival Strategy As a member of the beverage industry commit to providing the drinking water product and method of delivery that the consumers are requesting.
Should your company provide Point-of-Use? • Be competitive • Provide an environmentally friendly alternative to packaged water • Responsibly hydrate your customers workforce with a healthy high quality water beverage • Solve logistical issues • Storage, location, customer needs, security, etc. • Diverse product line • Show your customer you have a diverse product line and can handle all their office service needs • Increase revenue per account
Current business models for POU Companies • POU only • Majority of products on factored lease • local to regional based • Under capitalized • Technology varies with price • Sales driven business • Some use of coffee as accessary item • OCS • Equipment capitalization in house • Secondary offering to coffee • Mostly carbon filtration technology • Little water only accounts • Lower rental rate as add on to other business • Bottled Water • Used as a defensive tool to save accounts • Technology varies with price (usually lower price advantage) • National footprint companies have competitive advantage • Strong service and support network • Water treatment • POU model differs from Residential model • Uses good filtration technology • Rental rate higher than average • Services charges extra • Specialize in problematic water
Consumer drinking water options Option Challenge Bottled Water (HOD) Logistics, Environmental impact Cost Small package (PET) Logistics, Environmental impact Cost Tap Taste Health Employee satisfaction Point-of-Use Quality Service installation
Who do I target? • Accounts concerned about their environmental impact (Green organizations) • High volume accounts • Sanitary conditions make it necessary • Customer requests it • Cost issues • Security needs • Storage space issues • Companies concerned about health and Safety
Benefits to your customer: • Reduces environmental impact • Reduction of vendors • Better tasting coffee • Service at a level they are accustomed • Security • Fewer monthly accounts payable • Fixed budget • Ensures consistency in “Quality People, Products, and Service”
Your organizational benefit Capitalize on embedded competencies by entering into a business that compliments your existing organization • Route delivery and service team • Dedicated company sales force • Enhance service to your customer base • Billing and accounting procedures
Coffee Break! JK, That is only for your customers LOL, We have work to do! Is there a market to sell water? #getrich #opportunity #goodbusiness #BYA
POU should reach 15% of US water cooler sales in 2014 • Over 1 million POU coolers are installed in the US • 2014 is estimated to install over 150,00 units in the US • Market awareness is driving consumer demand for both high quality and low price options • Increasing market size is now determining the differentiation in business models. Such as Low cost, High quality, Brand etc.
The European market has set a baseline for assumed mature market penetration. The US is still far behind countries such as the Ireland, Denmark, Sweden and the UK.
POU Market • Positives • Increasing market growth potential • Less competition • Room for product differentiation • High barriers to entry for high quality competition • Negatives • Varying water sources require trained technical staff • Long term profitability model • Consumer acceptance • No proven residential model • Price competition from Bottle and Low cost POU companies • Large HOD companies offering POU products • Opportunities • Bottled water conversion • Institutional, Medical, hotel and restaurant accounts • Growing concern for green alternative • Free media from threatened water supplies • Residential market untapped
POU pricing structure • 12-18 month capitalized in-house payback average monthly rental (Water cooler) • R/O with disinfection $45-$55 (avg cooler cost $450-$550) • R/O $40-$50 (avg cooler cost $350-$400) • Carbon filtration (economy) $25-$35 (avg cooler cost $175-$225) • Market price driven by low cost imports and converted bottle coolers • 80% of coolers placed under a rental agreement • Rental agreement roll over 80-90% • Market is trending from all inclusive service to obligatory paid service and filter changes
Marketing survey • On-line survey, conducted by Amplitude Research • 500 respondents, screened for: • involved in the purchase and/or management of the complimentary employee beverage program (water and/or coffee) at their business • business size of at least 10 employees • job title Supervisor or higher
Respondent Profile • Respondents worked at businesses that employ at least 10 people and were personally involved with their company’s beverage program • Most respondents were employed with small to mid-sized businesses: • 29% have 10-49 employees (82% of companies with more than 10 employees) • 40% have 50-499 employees (17%) • 19% have 500-2499 employees (1%) • 11% have 2500+ employees (0.3%) • Most respondents were beverage program decision-makers(more than one response permitted): • 69% select/ decide a program • 40% recommend • 34% manage
Respondent Profile • 97% had water units on-site: • 41% have 1-4 • 46% have 5-99 • 10% have 100+ • 95% had coffee units on-site: • 48% have 1-4 • 38% have 5-99 • 9% have 100+ • Respondent title levels were evenly divided between Supervisor/Manager (53%) and Director-and-above (47%) • Respondents’ functional roles were in Operations (43%), followed by Office Management (19%): • 43% Operations • 31% Operations Management • 12% Facilities Management • 19% Office Management • 12% Finance • 11% Purchasing • 7% Human Resources • 8% other
Placement Environment • Primary beverage station placement is in office (45%) and operations (43%) locations: • In addition to employees, beverage stations often serve customers: Manufacturing 18% Retail16% Warehouse 9% [% of respondents]
Beverage Program Decision-Making • Beverage program decision-making responsibility is most often in Operations (41%) and Office Management (26%) Operations Mgt25% Facilities Mgt16% [% of respondents]
Path to Purchase • One-third of respondents switched to a new beverage program in the last three years • After price, customers are most motivated to drop a program due to dissatisfaction with service and equipment quality: [% of respondents; more than one response]
Path to Purchase • Customers learn about new beverage program suppliers primarily through peers, on-line search and sales rep contact: [% of respondents; more than one response]
Path to Purchase • When switching, customers are most motivated by the equipment and service quality offered by the new supplier (after price): [% of respondents; more than one response]
Beverage Program Benefits- Total Sample • Respondents do not identify a singular need they are seeking a beverage program to satisfy. Many different benefits are important – “morale,” “cost,” “great beverages,” “quick issue resolution” and “enjoyable work break” were all rated comparably: Not significantly different (95% confidence) [% very/extremely important]
Beverage Program Benefits-Total Sample • In identifying the one benefit most important to their decision, respondents selected a cluster of four (after cost): “morale,” “performance,” “enjoyable break” and “better health”: Not significantly different (95% confidence) [% chosen as most important]
Benefits Importance By Size of Company [% claimed as most important]
Beverage Product Attributes • Consistent across segments (and consistent with a “health” benefit), customers most seek delivered beverages that are “clean & safe/ free from contaminants”: Significantly different (95% confidence) Not significantly different (95% confidence) [% very/extremely important]
Beverage Program Features • After price, equipment (clean, reliable) and service are most important program features, followed closely by quick replenishment, great beverages and easy usage. Technology (filtration and electronics) are least important program features [complete ranking in Appendix]: Not significantly different (95% confidence) [% very/extremely important]
Beverage Program Features-Equipment • Most desired equipment capabilities include clean, reliable and easy dispense, followed closely by capacity and warranty protection: [% very/extremely important]
Beverage Program Benefits • Large company customers (500+ employees) exhibit a strong interest in “enabling better health” for employees: # employees at company [% rated as most important]
Beverage Program Features [% very/extremely important]
Summary • 500 respondents, involved in the purchase or management of their company’s water and/or coffee beverage program • Beverage programs are typically implemented in offices and operations facilities, and the program decision-maker’s functional area is most often operations-related • After price, service and equipment issues are greatest customer dis-satisfiers in the industry today • Larger organizations (500+ employees) prioritize “enable better employee health” as a desired benefit of a beverage program. Smaller organizations are more price-focused and do not appear to base purchase decisions on end-consumer benefits. • Customers universally place greatest importance on several program features: • Clean/safe beverages & clean equipment • Fresh beverages • Reliable equipment • Quick service & replenishment
Coffee Break! JK, Not Yet LOL, We need to know where we are going #Future #downtheriver #yourbusiness #tappedout
POU Future State • Advanced technology will drive consumer confidence • Market maturity will drive consolidation • POU market share of drinking water industry will grow substantially through 2017 • Increased concerns over water quality will drive usage from commercial to residential • Product technology will increase value to performance options for consumers
What to expect • 15% market share to mature at 35-45% • 1,00,000 POU coolers to 2,450,000-3,150,000 at maturity. • Residential solution will increase market opportunity • Environmental concerns over landfills/recycling Plastics and non renewable resources • Re-occurring revenue from filtration media and service • Potable water quality to deteriorate • Cost of delivery for packaged water tracking with increase fuel cost • Cost of technology to decrease with volume
Summary The POU segment of water industry continues to offer a good business opportunity for: • Entrepreneurs looking to establish a solid reoccurring revenue on a 5-7 year plan. • Businesses looking to expand their product offerings in Vending, OCS, Water Treatment and Bottle Water. • Companies offering environmental solutions. • Companies offering residential services • Retail water solution outlets
Robin Householder PHSI Email: Rhouseholder@Purehealthsolutions.com