Download

1 / 50
660 likes | 1.27k Vues
Purified Water Generation and Distribution System. Customer. HETRO LABS LIMITED, HYDERABAD. Picture 1. Picture 1. Picture. Picture. Purified Water Generation and Distribution System. We have supplied our Software solution to Hetro Labs, Hyderabad, AP.

E N D
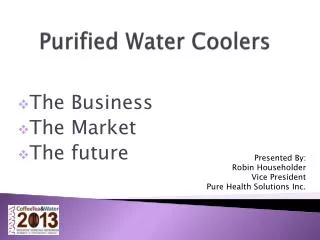
Purified Water Generation and Distribution System Customer HETRO LABS LIMITED, HYDERABAD
Purified Water Generation and Distribution System • We have supplied our Software solution to Hetro Labs, Hyderabad, AP. • There are 3 parts 1 Generation and other two are Distribution1 and 2 • Generation (RO+EDI) are having 4 processes in them each like Auto, Auto Flushing, Manual, Sanitization Hot water and Sanitization chemical. Distribution 1 and 2 are having 4 processes in each of them as Auto, Manual, Sanitization Hot water. • Currently which process is carried out in each of these three parts is shown on screen for operator understanding. • The displays are also shown to Indicate the Actual values. The Valves and Pumps are made on off directly clicking on them and making them on/off. The indications are also shown as per trip, on off etc. • The process is carried in Auto/Manual Mode. • Step Timings are given for each processes & are used when system is in Auto Mode • There are three types of reports generated and Detailed report, Audit trail report (as shown in picture), Alarms report. • Detailed report contains all present values of the parameters. Excel report is also generated. • Before implementing this system the operator has to do all the process manually but by using this system the operator can operate it in Auto Mode. The valves and pumps are opened and closed by just clicking on the symbols shown on screen.
Navy Chiller Test Bench System Customer Johnson Controls
Navy Chiller Test Bench System • We have supplied our Software solution to Johnson Controls, Chakan, Pune. • They are using our system for Chiller testing. The whole system contains Allen Bradley PLC and SCADA(E3). • The live values from PLC are taken by using OPC server. The live values also taken from power meter. They are using these meters for measuring current, Voltage, KVA, Temperatures, PF and KWH. • The reports generated are different from the common reports as shown in picture. These reports are called Performance test Report. The readings at different three times are locked in history and are shown on reports. We have also generated the reports for the batch reports for respective tests. The reports contains the present readings at every set interval and every test. • The reports are the major part of our system. • AS shown in pictures the reports are done.
Power Monitoring System Customer Idea Cellular Ltd.
Idea Cellular Ltd. • We have supplied our Software solution to Idea Cellular, Pune. • They are using our system for power monitoring purpose. • There are 6 power meter. They are using these meters for measuring current, Voltage, KVA, Temperatures, PF and KWH. • We have generated the reports for the same. The reports contains the present readings for every set time. As per the power meters readings, the graphs also shown on the screen. • Also we have provided the High and low thresholds for the parameters. If any value passes these limits the alarm will generate. As soon as the alarm is generated the annunciator shows indication and Hooter starts Ringing. If the acknowledgement is given the Hooter and Annunciate stops indicating. • Annunciate and Hooter reduces the work of continuous monitoring each meter.
System CIP System Customer PEPSICO, Palakkad, Kerala
CIP SYSTEM OF PEPSI,PALAKKAD • We have developed a software for PEPSICO, Palakkad, Kerala. • They are using our software for CIP (Cleaning In Process) System. • There are 2 types of processes involved in this viz. Preparation and CIP. Both are having 4 sub types each like 1step, 3step, 5step and 7step. According to our selection on screen the each type and subtype is selected and the process starts. • The Set points (In white displays SP) are also given which are essential for the PID controllers. According to which the process continues. The red displays are also shown to Indicate the Actual values. • The process is carried in Auto/Manual Mode. • Step Timings are given for each sub steps & are used when system is in Auto Mode • There are two types of reports generated Summary report and Detailed report. Graphical analysis is also done. • Summary report shows the Batch name, Start and stop time, Duration and User name. Excel report is also generated for the same. • Detailed report contains all present values of the parameters, Line and current step number and Its description. Excel report is also generated. • Graphical analysis contains the comparison between present values and set points. • Before implementing this system the operator has to do all the process manually but by using this system the operator can operate it in Auto Mode. The valves and pumps are opened and closed by just clicking on the symbols shown on screen.
System Shroud Fan Testing Assembly Customer PEE ARR EXIM, Pune
Shroud Fan testing Assembly • The Whole turnkey project is done by our team. This system is provided to our customer PEE ARR EXIM, Chakan, Pune. They are the manufacturer of the Shroud fans of AC in Cars. • We have developed the test bed for testing the Shroud fans. • The parameters under consideration are Current, Voltage, RPM, Noise, Vibration & Direction. • We have used the PLC, Control panel, Power supply for FAN, Vibration sensor, RPM & Direction Sensor & Noise sensor in our system. • The Screen shown in picture3 is Displays actual values of the various parameters, Part no., Serial No., Selection for 12/13.5V,Model name and Test OK/NOK. • The test bed checks the actual parameters with the thresholds of each which are given already. If does not fall under its criteria it shows “Test Fail” otherwise “ Test OK”. If Test is OK according to that the Barcode is generated. • The report shows the actual values of the parameters, part no, Job ID & Result. Excel Reports are also generated for the same. • Before implementing this system the test required more than 2 mins to carry the whole process. But by our system it require just 30 secs to complete whole process.
System Mass Flow Measurement Customer CREATIVE ENGINEER & CENTRIFUGE CONTROL PVT. LTD. PUNE
Mass Flow Measurement • The customer having 4 flow meters which are mounted on the flow lines used for the measuring flow of juices etc. There are 4 jumbo displays used for displaying the total value of the liquid in that day. • The values of the flow meters are taken by using advantech I/P cards. These values are taken on SCADA and displayed as shown in picture4. The taken value of Daily tantalizer is displayed on a jumbo display by using advantech O/P cards. • It shows the Tag name i.e. which type of liquid is on line, its description, Process value, Its Unit, Hourly Total, Daily Total & Cumulative total. • The Channel configuration screen (picture 5) is used to set the given parameters like enable/disable, Tag name & Its description, H/W high-low, S/W High-low, process value and its unit etc. Enable/Disable is used to enable or disable the i/p &/or o/p channels of the systems. • The reports are also generated for various readings as Daily report, Hourly report and Day wise hourly report. The reports given are in formatted type. • The Trends are also displayed on screen for observing the actual values against time. Bar graphs are also shown for readings of daily totaliser and present values.
System BMS LDU Systems Customer CIPLA, Verna, Goa.
BMS LDU System • This system is given to Honeywell and the end customer is CIPLA, Verna, Goa. • There is system Called BMS designed by Honeywell which is used to monitor and control the relative humidity, temperature and pressure etc parameters of various units at plant. • The parameters measured BMS sends on Excel Sheets and from Excel Sheet we have taken it on SCADA and from SCADA we sent it to LDUs (Local Display Units) placed in each units having different sizes as shown in picture6.The live values are displayed which is sent by BMS. • There are 8-9 plants of CIPLA and 8-10 LDUs in each plant. All are having our software in them. • Before implementing this software the operator in a room of specific plant has to call the control room for asking the parameters values. But now he can check it out on the LDUs given at each room.
System Production MonitoringSystems Customer Innovative Solutions, Pune.
Production Monitoring System • This system is implemented in Innovative Solutions, Pune. • It is the production monitoring system in which test pass test fail signal come from PLC with some additional test parameter. The result is stored in SCADA Software. • The reports are also generated in these reports we can observe the parameters like station, Model name, Quantity, Ratio, Result. There is also provision is given to filter the reports as per the Day, Shift, Month or Year. The reports are also given in Excel format. • These reports are taken for analysis also to compare the previous and present values.
System Process Control Systems Customer SAP Eggs. & Consultants, Pune.
Process Control System • Se&C are the manufacturer of training kits required for practical for Eggs. Colleges. The Software part is done by our team. • The system is having two PID (Proportional Integral Derivative) Loop. There are various parameters which has to be monitored viz. Pressure, Level, Rotation, Flow. • The PID compares the present value with set values and these all values given in and taken out by SCADA. • For each PID loop there is a different trends, reports and analysis is also done to compare the set points and present values. • College students are using these Kits for getting practical knowledge. Such system is implemented in various colleges in Pune.
System EOL Systems Customer BEHR India Ltd, Pune
End Of Line System • This system is given to BEHR India, Pune. They are using this system for testing the AC. • There are various no. of Digital inputs and outputs involved in this process which can be forced ON/OFF. Analog inputs like Current, Voltage, Vibration, Torque, Max airflow are all measured by the system. • The steps for testing is carried out which are entered in the model data entry screen (picture 10). Also modifications can be done in that steps and one can save them. Same for New Model. • The knobs & buttons also checked through these steps. • If the above parameters are within the set range and the all steps are OK then the TEST OK signal is generated and the barcode is given out for particular AC otherwise the TEST NOK signal is generated. • The reports are also generated by considering the above and also the following parameters like sift, AC ON, AC OFF, Recirculation ON/OFF & Vibration. • The SPC Screen shows the values of parameters as per the model selected in the screen. The details of all the parameter of same Model are seen by this(Picture11 ).
System Flow Measuring Systems Customer Godrej & Boyce Mfg. Co.
Flow Measuring System • This system is given to Forbes Marshal and the end customer is Godrej & Boyce Mfg. Co. They are using this system for monitoring Flow. • There are various measuring instruments for Pressure, Temperature and Flow etc. The all readings taken by these instrument are taken on SCADA. And total is shown on the tantalizer. (Picture12).Same is for East side. • Cumulative, Demand Vs Supply, Monthly and for last three years monthly report is generated for each plant. The 3 years report for each plant is shown in picture13.
System Rubber Vulcanizing System Customer Load Star Pvt. Ltd.
Rubber Vulcanizing System • This system is given to Forbes Marshal and the end customer is LoadStar Pvt Ltd. They are the Tyre manufacturers. They are using this system for rubber Vulcanizing. • The company having 24 Ovens for processing on tyre. As shown in picture13 the parameters considered are oven status, current time, given time, remaining time, mould temp, heal temp and Set points. Same for all 24 ovens. • The little window shown in picture13 is required to give tyre no., Size, Curing time, Start and Stop time, Set point and processes of particular Oven. • As per the tyre type the recipe is made considering temperatures required for process. • The reports are made considering the parameters like tyre sr. no., tyre size, start time, stop time, SP, Curing time, Soft temp, Heal Temp and Mould temp. • The excel reports for the same is also generated.
System Circuit Breaker Testing Systems Customer Schneider Electric (I) Pvt. Ltd.
Circuit Breaker Testing System • This system is given to Schneider Electric (I) Pvt. Ltd. They are using our software for testing the circuit breakers. • Test Start/Test Stop buttons ,NW/NT selection, Fixed/Drawout selection, Micrologic type and No. of poles are all settable parameters shown in picture15. • Test Report is also generated for the same showing order no, serial no, type, rework, pole no and finally result. The Excel reports are also generated for the same.
System Reports Generated Customer Rockwell Automation, Pune.
Rockwell Automation, Pune. • Reports are generated from “Access Database” files. All reports are filtered as shift wise, day wise etc.