Computational Thinking
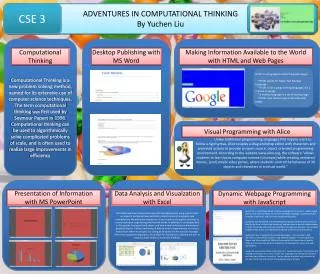
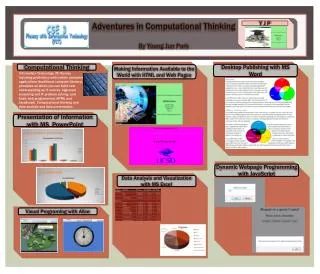
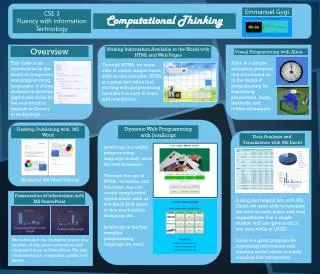
In CSE 3, we delve into computational thinking through desktop publishing with MS Word and presentations using MS PowerPoint. We discover color models, photo formatting, and document themes, alongside customization of HTML settings for web pages. By analyzing data in MS Excel, we create visually appealing graphs, charts, and presentations. We also utilize Alice software for 3D visual programming, making engaging scenes. This course emphasizes data analysis and presentation in IT, enhancing our skills in various Microsoft tools and web programming like HTML and JavaScript.

Computational Thinking
E N D
Presentation Transcript
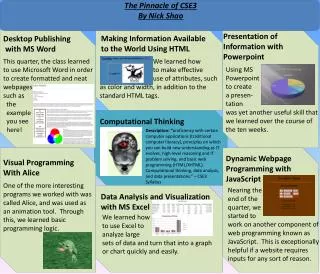
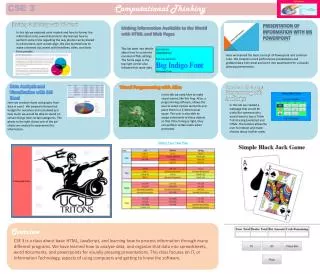
CSE 3 Computational Thinking Desktop Publishing with MS Word Presentation of Information with MS Powerpoint Making information Available to the World with HTML and Web Pages In this lab we explored color models and how to format the information onto a word document. We learned how to perform some tricks regarding the way photos can be placed in a document, such as text-align. We also learned how to make a themed document with headlines, titles, and fonts from presets. This lab went into details about how to customize common HTML settings. The home page in the top right corner also followed this same idea. Here we learned the basic concept of Powerpoint and common rules. We created a stock performance presentation and grabbed data from excel and put it into powerpoint for a visually pleasing presentation. Data Analysis and Visualization with MS Excel Dynamic Webpage Programming with JavaScript Visual Programming with Alice In this lab we used Alice to make visual scenes, like this frog. Alice, a programming software, allows the user to select certain elements and place them in a 3-dimensional space. The user is also able to assign commands to these objects so that if the timing is right, they can perform certain tasks when prompted. Here we created charts and graphs from data in excel. We created a theoretical budget for ourselves and calculated just how much we would be able to spend on certain things from certain categories. The photo to the right shows one of the pie charts we created to reperesent this information. In this lab we created a webpage that would be useful for someone who would want to buy a Triton T-shirt using JavaScript and HTML. The buttons allow the user to interact and make choices about his/her order. Overview CSE 3 is a class about basic HTML, JavaScript, and learning how to process information through many different programs. We have learned how to analyze data, and organize that data into spreadsheets, word documents, and powerpoints for visually pleasing presentations. This class focuses on IT, or Information Technology, aspects of using computers and getting to know the software.