Enhancing Environmental Indicators: A Collaborative Approach by Walter Radermacher
230 likes | 353 Vues
This paper by Walter Radermacher explores the complexity reduction in environmental indicators through collaboration among stakeholders like politics, science, and statistics. It highlights case studies, including the construction of macro indicators for the German sustainability strategy, emphasizing the need for iterative decision-making processes that include all actors. The discussion focuses on the importance of visualizing data for different user needs and ensuring the relevance of indicators. This work aims to foster integrated sustainability policies based on well-constructed indicators.

Enhancing Environmental Indicators: A Collaborative Approach by Walter Radermacher
E N D
Presentation Transcript
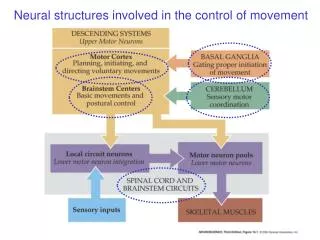
by Walter Radermacher Federal Statistical Office of Germany The reduction of complexity by means of indicators – Case studies in the environmental domain
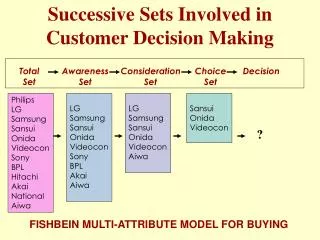
Involved actors: 1.1 Construction of Indicators Users(e.g. Politics) Statistics Science
Indicators are in trade-off between … 1.2 Construction of Indicators Scientific consistency Statisticalmeasurability Political relevance
2.1 From a detailed picture of reality… Teatro Massimo in Palermo
2.2 … you can zoom out… Teatro Massimo
2.3 … to get a very general view. Teatro Massimo
Statistics 3.1 Work system of the actor “statistics” macro indicators accounts, detailed indicators basic data
Statistics 3.2 Work systems of Statistics, Science and Politics macro indicators theoretical concept political programme accounts, detailed indicators political topic model individual actions basic data basic research Science Politics
4.1 Dominance of Science Example: green GDP → foundation: neo-classical concept (as theoretical concept), world can be explained by economic theory → indicators as a substitute of evaluation → process of indicator-building runs once: concept defines basic research, statistics collect the data, basic data are “summed up” to form the green GDP → middle level is irrelevant → no valuation or assessments by politics Risk: theoretically developed model solution, not suitable for practice
Statistics 4.2 Dominance of Science macro indicator theoretical concept basic data basic research Science Politics
4.3 Dominance of Politics Example: topic-specific indicators (“pollutant of the day”) → process of indicator-building runs once: departing from political goal, individual actions and regulatory steps are initiated, the effects have to be covered by basic data and represented by a topic indicator → top level is irrelevant → no assessment by science Risk: change of political goals, short-lived indicators, inconsistency
Statistics 4.4 Dominance of Politics accounts, detailed indicators political topic individual actions basic data Science Politics
4.5 Dominance of Statistics Statistics cone as shown on slide 8 Risk: ignores relevance Memo: Statistics should always take visualisation into account →different users need different information
5. Conclusion The ideal-type construction process: → involvement of all three actors → involvement of all three pyramid levels → discussion between the same pyramid levels (special role of science) → discussion within the work system → iterative decision-making process …
Statistics 6.1 Iterative decision-making process… A: Development of basic data (after consulting users) “laboratory” (theory) Science Politics
Statistics 6.2 …iterative decision-making process… B: Aggregation with scientific methods “laboratory” Science Politics
Statistics 6.3 …iterative decision-making process. C: Selection of indicators “bazaar” (negotiations) “laboratory” Science Politics
7. Implementation • The presented model has been successfully applied to the • construction of macro indicators for the state of the environment • (project was carried out 1998-2000). • The German sustainability strategy: • → 21 indicators for the 21st century were defined in 2002 • (by politics) • →incl. quantitative targets for most of them. • Aim: Developing an indicator approach for sustainability • that is embedded in accounts and data basis. • Result:Integrated sustainability policy.
For questions please feel free to contact: Walter RADERMACHER tel: +49-611 75 22 00 e-mail: walter.radermacher@destatis.de (Source: http://www.llda.gov.ph, Laguna Lake Development Authority)
Visualisation Example: Water-Mondriaan → pioneered by The Netherlands (CES/1995/R.3) → graphical presentation of water systems and water types, the colour of each box represents the state of the water → provides a quick picture of the overall status of water → the original data behind the aggregated map can be viewed