Download
1 / 16
160 likes | 268 Vues
State of the Air Report 2011. Katie King Director, Health Promotion & Public Policy American Lung Association of New England. Annual American Lung Association nationwide report on air pollution Gives A- F and Pass/Fail grades to 900 counties with monitors

E N D
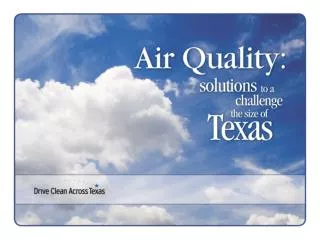
State of the Air Report 2011 Katie King Director, Health Promotion & Public Policy American Lung Association of New England
Annual American Lung Association nationwide report on air pollution Gives A- F and Pass/Fail grades to 900 counties with monitors Provides data by county, state info by zip code Ranks 25 metro areas with worst/least pollution • What is the State of the Air?
Why do we publish State of the Air? Puts air pollution into everyday language Gives public local information Focuses attention on ozone and particle pollution Tells people how to protect themselves Encourages and supports programs to cut pollution and improve air quality
What We Grade • Ozone (O3) • Particle pollution (PM2.5) • Short-term spikes (24-hour) • Year-round measures (annual average)
What do the grades mean? • A= 0 days with unhealthy levels over 3 years • B= 1 to 2 unhealthy days • C= 3 to 6 unhealthy days • D= 7 to 9 unhealthy days • F= 9 or more unhealthy days
Year-Round Particle Pollution • No AQI exists to use as a scale • Graded Pass/Fail compared to national standard of 15.0 μg/m3 • Use EPA’s calculation for each county 15.1+ = Fail 15.0 or less= Pass
www.stateoftheair.org • Type in zip code to get county grades • Compare air quality in two cities • Get rankings for every city • Get trend charts for every city
Questions? Thank you! Katie King kking@lungne.org (781) 314-9011