Download
1 / 37
370 likes | 484 Vues
Solar Sources of Earth-affecting Energetic Particles. Nat Gopalswamy NASA Goddard Space Flight Center Thanks to: H. Xie, P. Mäkelä, & S. Yashiro. 11th Annual International Astrophysics Conference, March 19-23, 2012 Palm Springs, CA. Plan of the Talk. Introduction

E N D
Solar Sources of Earth-affecting Energetic Particles Nat GopalswamyNASA Goddard Space Flight Center Thanks to: H. Xie, P. Mäkelä, & S. Yashiro 11th Annual International Astrophysics Conference, March 19-23, 2012 Palm Springs, CA
Plan of the Talk • Introduction • SEP events of Solar Cycle 23 • SEP events of Solar Cycle 24 • Other indicators of space weather events: Halo CMEs, Type II radio bursts • SEP butterfly diagram • Interacting CMEs • Summary
Introduction • Consider large SEP events (proton intensity ≥ 10 pfu in the >10 MeV GOES energy channel) • Do not consider radiation-belt energetic particles although they are also important for space weather (Parks, Raeder) • Rise phases of cycle 23 & 24: June 1996 – May 2000 [cycle 23] • Jan 2008 – December 2011 [cycle 24] to March 2012? • Phases important: Storm season • Solar rotation and solar cycle bring active regions facing Earth
PE Locations + Butterfly Diagram 23 Maximum 24 Maximum? 22/23 Min 23/24 Min
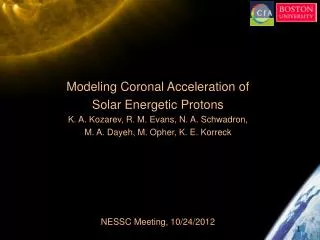
SEP-producing CMEs from the Active Region Belt • Solar Sources generally within ±30o Lat. • maximum and declining phases important • Solar sources are generally located in • the western hemisphere because • magnetic connectivity to Earth for • SEPs affecting Earth • Active regions emerge at any longitude • but those in the western hemisphere • are likely to send particles to Earth DECL MAX RISE
Solar Sources of Earth-affecting CMEs Geoeffective SEP-producing Gopalswamy, 2009
Large SEP Events of Cycle 23 61% Halos Average speed of ordinary CMEs: 475 km/s Fraction of halo CMEs: 3% Acceleration ~0 SEP-producing CMEs are very energetic
The smallest and largest events CME at 10:12 UT V = 1205 C4.4 flare from AR 1099 N17W52 3000/6310 pfu CME at 04:12 UT V = 2102 M8.7 flare from AR 1402 N28W36 14 pfu
17 Events during cycle 23 Large SEP Events of Cycle 24 **Long filament, ) Previous day, afirst is SEP peak, second is ESP peak
Three Phases of the Cycle DECL MAX RISE
Three Phases of the Cycle DECL MAX RISE
Where are the solar sources? s 2010 Aug 14 N17W52 Cycle 23 2y 3.7y 2006 Dec 13 S05W23 1995 Oct 20 S09W55 Cycle 24 1997 Nov 04 S14W33 21/22 min only 0.5y w/o SEPs
Reason for Asymmetry: Active regions in the North 23 Maximum 24 Maximum? 22/23 Min 23/24 Min
Major SEP Events: 1976 - present s 21 Max 22 Max 23 Max
Speeds of SEP-producing CMEs CYCLE 23 s Cycle 24 1588 km/s Cycle 23 (Rise) 1710 km/s Cycle 24 CMEs 20% faster 1423 km/s
Cycle 24 Events and the Cumulative Distribution of SEP intensities 2010 & 2011 events Jan & Mar 2012 233 large SEP events 1976 – 2012 March Cycle 24 Cycles 21-24
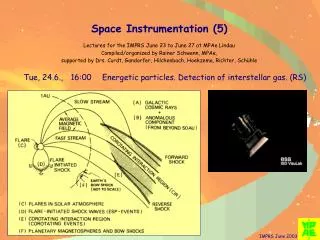
Other Signatures of SEP events • Type II radio bursts (metric and interplanetary) • Halo CMEs • Shocks detected in situ at L1 using plasma and wave signatures
Less # of type II bursts during cycle 24 m 221 IP 101 m 91 IP 68
Annual #of IP Type II Bursts * until May 31, 2000 2* # SEP events 7 8 5 4 2 * Until March 22 2012 * 1 IP 101 IP 68
First Large SEP Event: No metric Type II SEP onset CME 1205 km/s -43 m/s2
No metric Type II Burst Type III
Weakest Type II & Shock 2010/08/14 10:00 Weak Type II 2010/08/14 11:0 6 Type III Shock seems to be detaching
Type II Burst & Shock 36h SHOCK Type II Type III The shock continued to produce radio emission all the way to the Wind Spacecraft
TNR Shock 2012/01/24 14:33 f2/f1 = 1.5 n2/n1 = 2.25
Two CMEs from the same region Two CMEs seen distinctly in STEREO Data. COR1 + EUVI 195 A images STEREO/Ahead – limb event
Also from STEREO/Behind SHOCK
Trajectories of the two Jan 23 CMEs CME1 CME2
Two CMEs - same speed, <1-hr apart CME1 CME2
Double X-ray Flares 00:02 01:05 AR 1429
Type II Burst & Shock 2012/03/08 35h SHOCK
*Two backside events no flare info; ** Only 13 CMEs; CME data gap for 4 SEP events Cycles 23 & 24 Dst < -100 nT 23 vs. 3
Summary • The number of large SEP events is relatively low during the rise to the maximum of cycle 24 – similar to shock activity • CME, flare, active region properties are similar to those of cycle 23 • Longest interval between cycle 23 and 24 SEP events (~4 years) • Geomagnetic activity is even more subdued • The two largest events involve interacting CMEs