Reverse Logistics Project
Reverse Logistics Project. Dr. Dale S. Rogers Jessica Palmer Kasia Banasiak Michael White Center for Logistics Management University of Nevada Reverse Logistics Executive Council April 2002. U.S. Reverse Logistics Costs. Total U.S. Logistics Costs $1,006,000,000

Reverse Logistics Project
E N D
Presentation Transcript
Reverse Logistics Project Dr. Dale S. Rogers Jessica Palmer Kasia Banasiak Michael White Center for Logistics Management University of Nevada Reverse Logistics Executive Council April 2002
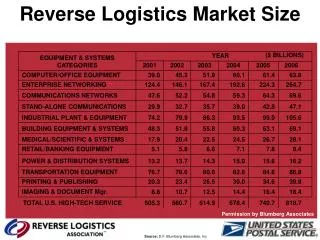
U.S. Reverse Logistics Costs Total U.S. Logistics Costs $1,006,000,000 Approximate RL cost % 4.00% Estimated U.S. RL Costs $40,240,000 Source for U.S. total costs Bob Delaney, 12th Annual State of Logistics Report.
Outsourced Services:2001 vs 2000 Service 2001 2000 Warehousing 73.7% 63.3% Outbound Transportation 68.4% 60.7% Freight Bill Auditing/Payment 61.4% 59.8% Inbound Transportation 56.1% 44.6% Freight Consolidation/Distribution 40.4% 32.1% Cross-Docking 38.6% 25.0% Product Marking/Labeling/Packaging 33.3% 19.6% Manufacturing Activities 29.8% 39.3% Product Returns & Repair 22.8% 17.9% Inventory Management 21.0% 10.7% Traffic Management/Fleet Operations 19.3% 21.4% Information Technology 17.5% 8.9% Product Assembly/Installation 17.5% 8.9% Order Fulfillment 15.8% 10.7% Order Entry/Order Processing 5.3% 2.7% Customer Service 3.5% 4.5% Source: Langley, Allen & Tyndall, (2001) Third Party Logistics Study: Results and Findings of the Sixth Annual Study. Cap Gemini Ernst & Young.
Market Trends • Historic & projected growth • Are programs similar to P&G's SLOW program the wave of the future?
Total 3PL Market • For 2000, the total U.S. 3PL market was $56 billion. • For the last several years the 3PL market in the U.S. has grown at a 5% compounded growth rate. Source: Dick Armstrong & Bob Delaney
Closed-Loop Supply Chains • The disposition choice is determined by the most profitable alternative: • Reconditioning – when a product is cleaned and repaired to return it to a “like new” state. • Recycle – when a product is reduced to its basic elements, which are reused. • Refurbishing – similar to reconditioning, except with perhaps more work involved in repairing the product. • Remanufacturing – similar to refurbishing, but requiring more extensive work; often requires completely disassembling the product. • Resell – when a returned product may be sold again as new.
Closed-Loop Supply Chains • Scope of Remanufacturing • Estimated to be in excess of 73,000 remanufacturing firms in the United States • Direct employment 350,000 • Total annual sales $53 billion Source: Robert T. Lund, The Remanufacturing Industry: Hidden Giant, Boston University
Zero Returns • Manufacturer or distributor does not allow any returns to come back all of the way through the channel. • Give the retailer or other downstream entity a return allowance and develop an agreement with the retailer as to what acceptable disposition of the product can be. • A typical return allowance is 3.5-4% of sales to retailer.
Zero Returns • Reduces the variability of returns costs. • Retailer has to take responsibility for minimizing returns. • Enables the firm to avoid the problem of physically dealing with returns altogether. • Does not reduce much of the physical burden placed on downstream channel participants. • Cannibalization of “A” channel concerns. • 2%/6% Problem
Zero Returns • For the most part, zero returns programs have not been successful. • Loss of control. • Potentially dangerous.
Competitive Landscape Analysis • Number of companies within the market space • Detailed information by company
Project • Identified 136 U.S. 3PL firms that said they were involved in reverse logistics. • Called all of these firms and interviewed 58 firms (42.6% response rate).
Survey Questions • What reverse logistics services does your company provide? • Which industries does your company serve in the reverse logistics arena? • Does your firm have reverse logistics IT system capabilities? • What type of system? • Percentage of firm revenue derived from IT system? • Reverse logistics revenues as a percentage of total revenue? • Do you expect reverse logistics activities to increase?
What reverse logistics services does your company provide? • Transportation 47% • Reman, refurb, recycling 17% • Full line 16% • Warehousing 9% • Software 7% • Recalls 5%
Which industries does your company serve in the reverse logistics arena? • Electronics 22% • Consumer Goods 17% • All industries 16% • Automotive 14% • Food 14% • Pharmaceutical 3% • Forest products 3% • Software 2%
Does your firm have reverse logistics IT system capabilities?
What type of systems? • Return tracking, RMA 33% • Dispositioning 9% • WMS 24% • Retail 3% • Manufacturing 2%
Percentage of firm revenue derived from IT system? • 4 software firms included in study • Other than software companies IT revenues unimportant
Reverse logistics as percentage of total revenues • Only two firms said RL revenues were greater than 10% • RL revenues for all other firms were less than 10% • Mode = 5%