Reverse Logistics Market Size
Reverse Logistics Market Size. ($ BILLIONS). EQUIPMENT & SYSTEMS CATEGORIES. YEAR. 2001. 2002. 2003. 2004. 2005. 2006. COMPUTER/OFFICE EQUIPMENT. 39.0. 45.3. 51.9. 60.1. 61.4. 63.8. ENTERPRISE NETWORKING. 124.4. 146.1. 167.4. 192.6. 224.3. 264.7. COMMUNICATIONS NETWORKS.

Reverse Logistics Market Size
E N D
Presentation Transcript
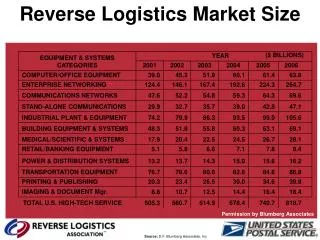
Reverse Logistics Market Size ($ BILLIONS) EQUIPMENT & SYSTEMS CATEGORIES YEAR 2001 2002 2003 2004 2005 2006 COMPUTER/OFFICE EQUIPMENT 39.0 45.3 51.9 60.1 61.4 63.8 ENTERPRISE NETWORKING 124.4 146.1 167.4 192.6 224.3 264.7 COMMUNICATIONS NETWORKS 47.6 52.2 54.8 59.3 64.3 69.6 STAND-ALONE COMMUNICATIONS 29.9 32.7 35.7 39.0 42.8 47.1 INDUSTRIAL PLANT & EQUIPMENT 74.2 79.9 86.3 93.5 99.0 105.6 BUILDING EQUIPMENT & SYSTEMS 48.3 51.8 55.8 60.3 63.1 69.1 MEDICAL/SCIENTIFIC & SYSTEMS 17.9 20.4 22.5 24.5 26.7 29.1 RETAIL/BANKING EQUIPMENT 5.1 5.8 6.6 7.1 7.8 8.4 POWER & DISTRIBUTION SYSTEMS 13.2 13.7 14.3 15.0 15.6 16.2 TRANSPORTATION EQUIPMENT 76.7 78.6 80.6 82.6 84.6 86.8 PRINTING & PUBLISHING 20.3 23.4 26.5 30.0 34.6 39.9 IMAGING & DOCUMENT Mgr. 8.8 10.7 12.5 14.4 16.4 18.4 TOTAL U.S. HIGH-TECH SERVICE 505.3 560.7 614.9 678.4 740.7 818.7 Permission by Blumberg Associates Source: D.F. Blumberg Associates, Inc
Magnitude of Returns • Managing the reverse supply chain is a very different and much more complex matter than trying to make an organization’s forward supply chain more efficient and cost-effective - Dr. Ho Kim (2003) • Scale: US companies spend roughly $45 Billion annually on returns logistics • Impacts Many Customers: According to Consumer Electronics Industry survey, the average returns rate is 8.46%, but high tech returns can be as high as 20% in some sectors • Evolution: Reverse Logistics is shifting from being seen as a “necessary evil” to being recognized as a strategic asset – reducing costs, improving customer care and helping to grow the business Source: Prasad Thrikutam, Sandeep Kuman
Magnitude of Returns • “There are up to 12 times the number of transactions involved in the returns process than in selling the product in the first place.” - AMR, Nigel Montgomer • Enterprises are struggling with excess inventories, suboptimal performance levels, diminished customer satisfaction & missed opportunities for cross-selling and up-selling aftermarket service & parts - Aberdeen Group • “The cost of processing a return can be two to three times that of an outbound shipment.” - RLEC • “Improperly handled returns erode 30-35% of potential profits.” - Gartner
Magnitude of Returns $100 billion in goods returned each year .5% of GDP 10% of total US logistics costs (est. at $1 trillion) Dr. James R. Stock, Product Returns/Reverse Logistics in Warehousing, 2004 Dr. Dale S. Rogers and Dr. Ronald S. Tibben-Lembke Going Backward: Reverse Logistics Trends and Practices, 2000
RL Adds to Bottom Line Products After tax Profits Are They Measured Right Product Production Cost Returns Take Away From Bottom Line Profits Reverse Logistics Management Your Company Manufacturers 1 Million Units Per Year Revenue per Unit is $1 or $1,000,000 Profit per unit is 5% After Tax or $50,000 Return Rate Average is 10% or 100,000 units Returns Represents $100,000 of Sales or $50,000 negative to bottom line Reverse Logistics Recovers 80% of the Returns or $80,000 to company bottom line Company’s After Tax Profit is $30,000 So who is most important, the VP of Marketing/Sales that took $50K from your Company or the Reverse Logistics Professional that gave you $30K of After Tax Profit?
RL Cost Compared to Forward Survey data by RLA and San Jose State University