Download
1 / 12
120 likes | 225 Vues
This conference presentation by Kevin M. Hollenbeck summarizes and compares key findings from four major studies on the Workforce Investment Act (WIA) and its net impacts on workforce development. These studies examine employment and earnings outcomes for participants, employing quasi-experimental methodologies using administrative data. Key takeaways highlight the substantial social returns on training and education programs, particularly for dislocated workers, where investment costs warrant stronger support mechanisms. Policy implications and detailed earnings analyses are discussed to inform decision-makers.

E N D
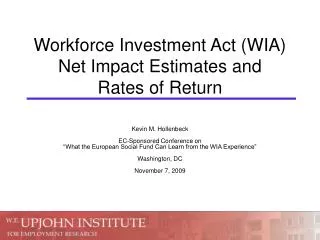
Workforce Investment Act (WIA)Net Impact Estimates and Rates of Return Kevin M. Hollenbeck EC-Sponsored Conference on “What the European Social Fund Can Learn from the WIA Experience” Washington, DC November 7, 2009
Purpose • Summarize and compare results from: (1) Hollenbeck & Huang, Net Impact and Benefit-Cost Estimates of the Workforce Development System in Washington State, 2003 • Hollenbeck & Huang, Net Impact and Benefit-Cost Estimates of the Workforce Development System in Washington State, 2006 (3) Hollenbeck & Huang, Workforce Program Performance Indicators for The Commonwealth of Virginia, 2008 (4) Hollenbeck, Return on Investment Analyses of a Selected Set of Workforce System Programs in Indiana, 2009
Background • All four studies are net impact evaluations • An individual encounters a workforce program and is offered services (treatment). • Outcomes ensue (we’re mainly interested in employment and earnings) • Net impact is the difference between outcomes and what would have happened if the individual did not receive the treatment (counterfactual) • Null hypothesis is that net impact is zero. • The two Washington State studies and the Indiana study go beyond net impact and examine rates of return.
Approach (Methodology) • Quasi-experimental • “Treatment group” from administrative data; “comparison group” from Employment Service data (usually) • ”Treatment” in studies (1) to (4) defined as “encountered the workforce program,” i.e. in WIASRD for WIA clients • Statistical matching used to construct comparison group • Matching variables – mainly pre-program labor force, and also demographics and education at program entry
Approach(Data and time periods) • In Washington • Data are program administrative files (WIASRD and ES) linked to UI wage, UI benefit, and TANF/Food Stamps/Medicaid records. Exiters from programs in PY 1997 and 1999 (study 1) and PY 2001 and 2003 (study 2). • In Virginia • Data are WIASRD and ES files linked to UI wage records (includig WRIS). Exiters in PY 2005. • In Indiana • Data are WIASRD and ES files linked to UI wage records and UI benefit data. Exiters in PY 2006.
Typical Earnings Profiles of a Training Participant and Comparison Group Member Real earnings Training participants D12 D1 Comparison group Training period 12 age
Discounted Benefits and Costs and Rates of Return for Washington’s Education and Training System over Working Lifetime, by Program (r.o.i. are quarterly interest rates)
Comparisons to National JTPA Study (NJS) Net Impacts of JTPA II-A NJS (U.S. GAO study using wage record data; inflated to $2005/2006)) • Benefit-Cost of JTPA II-A NJS 30 months after registration Social b-c 1.50 (Abt report) WA state 30 months after exit Social b-c 1.21
Policy Implications • Can use administrative data to estimate net impacts of education and training programs • Decomposing earnings impacts into employment, hours, and wage rates adds insight • Public and society reap substantial returns on training programs, although the payoffs take more than 10 quarters to achieve • The rate of return analysis shows that dislocated workers, in particular, have substantial investment costs, so that policy makers may wish to consider stronger support mechanisms for them
Comments or questions are welcome. The author can be reached at (269) 385-0431; or hollenbeck@upjohn.org W.E. Upjohn Institute for Employment Research, 300 S. Westnedge Ave., Kalamazoo, MI 49007-4686 The views expressed do not necessarily represent those of the Institute or its Board of Trustees.


![[Local] Workforce Investment Board](https://cdn2.slideserve.com/4232853/local-workforce-investment-board-dt.jpg)