Download
1 / 58
580 likes | 737 Vues
Hurricanes and Other Storms in a Warmer World. Kerry Emanuel Massachusetts Institute of Technology. Program. Climate and Extreme Weather Climate control of hurricane frequency and intensity. Heat Waves. 2060s. observations HadCM3 Medium-High (SRES A2). 2040s. 2003.

E N D
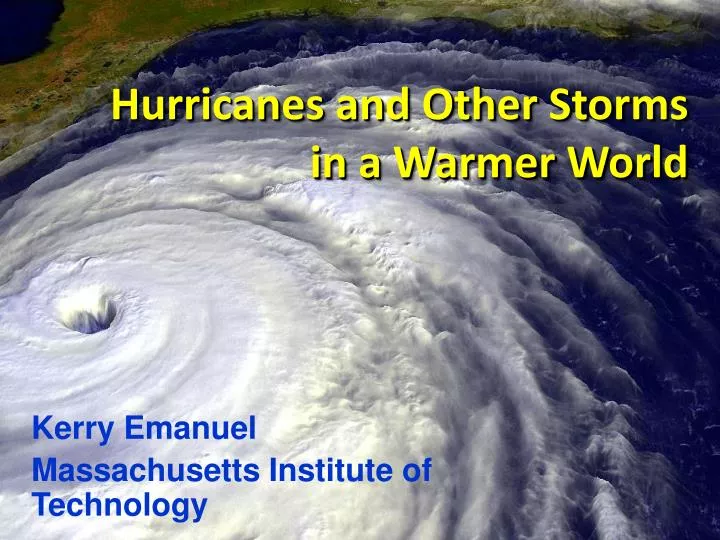
Hurricanes and Other Storms in a Warmer World Kerry Emanuel Massachusetts Institute of Technology
Program • Climate and Extreme Weather • Climate control of hurricane frequency and intensity
Heat Waves 2060s observations HadCM3 Medium-High (SRES A2) 2040s 2003 Temperature anomaly (wrt 1961-90) °C
High vs Low Temperature Records 2011- 2.7:1
Sherwood and Huber, PNAS, 2010 Adaptation Limit: Maximum Tolerable Wet Bulb Temperature 12o increase in mean global T
Intensity Theory Potential Intensity: Maximum sustainable surface wind speed in a given thermodynamic environment (sea surface temperature and atmospheric temperature profile)
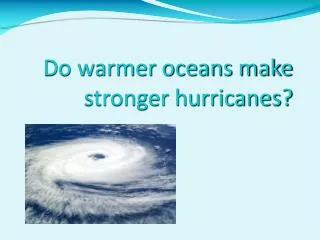
What Climate Parameters Determine the Tropical Cyclone Frequency?
Global Tropical Cyclone Frequency, 1980-2011 2012 Data Sources: NOAA/TPC and NAVY/JTWC
Inferences from Cloud-Permitting Modelswith Marat Khairoutdinov, SUNY Stony Brook • Doubly-periodic, radiative-convective equilibrium with specified, uniform SST • Horizontal grid spacing of 1-3 km • Pushes current computational capabilities
Self-Aggregation is Temperature-Dependent (Nolan et al., 2007; Emanuel and Khairoutdinov, in preparation, 2013)
Self-Aggregation on a Rotating Planet Vincent Van Gogh: Starry Night Distance between vortex centers scales as Vpot/f
Sea Surface Temperature Scaled to Observed Hurricane Power Dissipation, 1980-2011
Our Approach to Downscaling Tropical Cyclones from Climate Models • Step 1: Seed each ocean basin with a very large number of weak, randomly located vortices • Step 2: Vortices are assumed to move with the large scale atmospheric flow in which they are embedded • Step 3: Run a coupled, ocean-atmosphere computer model for each vortex, and note how many achieve at least tropical storm strength; discard others • Step 4: Using the small fraction of surviving events, determine storm statistics.
50 MIT Synthetic (various colors) and 8 Historical Hurricanes (lavender) Affecting New Haven
Storm Surge Simulation SLOSH model (Jelesnianski et al. 1992) ADCIRC mesh ~ 102 m SLOSH mesh ~ 103 m Battery ADCIRC model (Luettich et al. 1992) ADCIRC mesh ~ 10m (Colle et al. 2008)
Downscaling of AR5 GCMs • GFDL-CM3 • HadGEM2-ES • MPI-ESM-MR • MIROC-5 • MRI-CGCM3 Historical: 1950-2005, RCP8.5 2006-2100
GCM flood height return level (assuming SLR of 1 m for the future climate ) Black: Current climate (1981-2000) Blue: A1B future climate (2081-2100) Red: A1B future climate (2081-2100) with R0 increased by 10% and Rm increased by 21% Lin et al. (2012)
Summary • Hurricanes appear to be sensitive to climate • Hurricane power has more than doubled in the North Atlantic over the past 25 years
Simple but high resolution coupled hurricane model can be used to ‘downscale’ hurricane activity from global climate data sets • Studies based on this downscaling suggest some sensitivity of hurricanes to climate state, with increasing incidence of intense storms as the climate warms
Global annual frequency of tropical cyclones averaged in 10-year blocks for the period 1950-2100, using historical simulations for the period 1950-2005 and the RCP 8.5 scenario for the period 2006-2100. In each box, the red line represents the median among the 5 models, and the bottom and tops of the boxes represent the 25th and 75th percentiles, respectively. The whiskers extent to the most extreme points not considered outliers, which are represented by the red + signs. Points are considered outliers if they lie more than 1.5 times the box height above or below the box.
Change in track density, measured in number of events per 4o X 4o square per year, averaged over the five models. The change is simply the average over the period 2006-2100 minus the average over 1950-2005. The white regions are where fewer than 4 of the 5 models agree on the sign of the change.
Probability Density of TC Damage, U.S. East Coast Damage Multiplied by Probability Density of TC Damage, U.S. East Coast
Mendelsohn et al., 2012 Climate change impacts on tropical cyclone damage by region in 2100. Damage is concentrated in North America, East Asia and Central America–Caribbean. Damage is generally higher in the CNRM and GFDL climate scenarios.
Present and future baseline tropical cyclone damage by region. Changes in income will increase future tropical cyclone damages in 2100 in every region even if climate does not change. Changes are larger in regions experiencing faster economic growth, such as East Asia and the Central America–Caribbean region.
Climate change impacts on tropical cyclone damage by region in 2100. Damage is concentrated in North America, East Asia and Central America–Caribbean. Damage is generally higher in the CNRM and GFDL climate scenarios.