Download
1 / 22
220 likes | 371 Vues
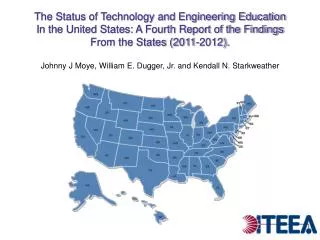
The Status of Technology and Engineering Education In the United States: A Fourth Report of the Findings From the States (2011-2012). Johnny J Moye, William E. Dugger, Jr. and Kendall N. Starkweather.

E N D
The Status of Technology and Engineering Education In the United States: A Fourth Report of the Findings From the States (2011-2012). Johnny J Moye, William E. Dugger, Jr. and Kendall N. Starkweather
Previous Studies Published in TTT(& on ITEEA’s Website - see surveys at the bottom of page - http://www.iteea.org/TAA/Publications/TAA_Gallup.html) • Newberry, 2001 • Meade and Dugger, 2004 • Dugger, 2007
Methodology/Timeline: • Prepare questionnaire (October – November, 2011). • Zoomerang (sent questionnaires to each state supervisor - November, 2011). • Numerous follow-up phone calls (January - February, 2012). • Analyze data and write article (February – March, 2012). • Article at ITEEA for editing and layout (March –April, 2012). • Article to be published in TET (May – June, 2012).
Contents of the Questionnaire: • 14 questions total • Questions 2, 3, & 7 were in 2001, 2004, and 2007 studies • Questions 8 & 9 were in 2004 and 2007 studies • Questions 4, 10, 11, 12, & 13) were in 2007 study • Questions 1, 5, 6, and 14 were new in the 2011-12 study
Architecture of Article: • Actual article will be in in 2012 May/June TET. • Because of space limitations, we created an “Appendix” of state-by-state responses at an URL site (accessible through article listings).
Question 1: Please provide the following contact info: • Name: • State: • Telephone: • Forty-two of the 50 state supervisors (84%) responded to the study. • All state supervisors did not answer all questions. • The states that did not respond to this study were Alaska, Louisiana, Michigan, Montana, New Mexico, Oklahoma, Vermont, and Washington.
Question 2. Is technology and engineering education in your state framework? Check all that apply.
Question 3. Is technology and engineering education required in your state?
Question 4. If you answered yes to question #3, indicate the geographic level of the requirement. Check all that apply.
Question 5. If you answered yes to question #3, indicate the grade level required. Check all that apply.
Question 6. Please give an estimated number of elementary schools (K-5/6) in your state that are teaching technology and engineering activities. • Eighteen of the 42 supervisors (43%) indicated that 787 elementary schools offer technology and engineering education in their states.
Question 7: Please give an estimated number of technology and engineering teachers in your state during this school year at the following levels: • Grades 6-8 • Grades 9-12 • Total: • Thirty-two of the 42 supervisors (76%) reported on this question that there are approximately 6,200 middle school and 9,666 high school technology and engineering education teachers. • Two additional states provided the total number (not by MS or HS breakout) of technology and engineering education that they had in their states, which were: 1,100 and 175. • In total, the 34 reporting supervisors indicated that there were approximately 17,141 technology and engineering education teachers in their states.
Question 8. Have you used the Standards for Technological Literacy: Content for the Study of Technology (STL) in any of the following ways? Click all that apply.
Question 9. Have you used Advancing Excellence in Technological Literacy: Student Assessment, Professional Development, and Program Standards (AETL) in any of the following ways? Click all that apply.
Question 10. Does your state have statewide assessments to measure what every student should know and be able to do in technology and engineering education? If yes, please share how it is used.
Question 11. What course title(s) best describe the secondary level technology and engineering education being taught in your state? • Thirty seven states (88%) responded with one or more types of course titles in their states. • The most frequent response was engineering (24 times), followed by technology education (23 times), Project Lead The Way (10), and Engineering by Design (3). • Five of the 42 supervisors (12%) did not provide any specific titles.
Question 12. Do you have a technology and engineering education state curriculum guide(s)?
Question 13. What best describes where technology and engineering education program funding comes from in your state (i.e., local, state, national funding, or combination)? • All 42 of the reporting states (100%) responded to this question. • Their responses were very similar to the 2007 study. • Thirty-six of the 42 states (86%) indicated that their funding came from a combination of local, state, and federal (Perkins) funds, three (7%) came solely from national, one (2%) from state, and one (2%) from local sources. One state supervisor stated “Tech ed is not funded.”
Question 14. What percentage of funding sources are obtained for technology and engineering programs in your state? • % STEM • % Career and Technical Education (CTE) • % Specialized technology & engineering sources (grants/special projects) • % Other, please specify • Thirty-six of the 42 states (86%) responded to the question. • However, only 22 (52%) provided actual percentages. • The majority of funding came from CTE (19), followed by specialized technology and engineering sources (14), “other” (8), and then STEM (6). The “other” funding category was basically the equivalent to local funding.
Importance of initiating and continuing research in our profession: • Recommend that this study be replicated in 5 years. • Trend research provides a basis for wiser association decisions making.
SUMMARY Summary
INTERNATIONAL TECHNOLOGY AND ENGINEERING EDUCATORS ASSOCIATION 1914 Association Drive, Suite 201 Reston, VA 20191 (703)860-2100 – Fax (703)860-0353 iteea@iteea.org www.iteea.org