Download
1 / 72
730 likes | 903 Vues
Visualization Taxonomies and Techniques Text: Words, phrases, sentences, …. University of Texas – Pan American CSCI 6361, Spring 2014. Introduction. Text is ubiquitous Documents, and more generally text, are a primary information source (Verbal has its place!)

E N D
Visualization Taxonomies and TechniquesText: Words, phrases, sentences, … University of Texas – Pan American CSCI 6361, Spring 2014
Introduction • Text is ubiquitous • Documents, and more generally text, are a primary information source • (Verbal has its place!) • Access to documents and text has grown exponentially in recent years due to networking infrastructure • WWW • Digital libraries • Social media • Visualization to aid users in understanding and gathering information from text and document collections
Introduction From Stasko, 2013 • Visualization can aid in performing tasks • For example: • Which documents contain text on topic XYZ? • Which documents are of interest to me? • Are there other documents that are similar to this one (so they are worthwhile)? • How are different words used in a document or a document collection? • What are the main themes and ideas in a document or a collection? • Which documents have an angry tone? • How are certain words or themes distributed through a document? • Identify “hidden” messages or stories in this document collection. • How does one set of documents differ from another set? • Quickly gain an understanding of a document or collection in order to subsequently do XYZ. • Understand the history of changes in a document. • Find connections between documents.
IntroductionChallenges of Text Visualization • Text is unlike other data types seen so far, for example • Context and Semantics • Context relevant to understanding and meaning • Indeed, natural language understanding a challenge of the nth + 1 century • Dimensionality • Inherently, “not dimensional”, so must create “visually realizable” visual encoding • Often, first step is n-D, then 2- or 3-D • Modeling Abstraction • Consider level of “understanding” require for task • Match analysis task with appropriate tools and models
IntroductionRelated topics • Information Retrieval • Active search process that brings back particular/specific items (will discuss that some today, but not always focus) • InfoVis and HCI can help some… • Visualization may be most useful when not sure precisely what you’re looking for when retrieving information • More of a browsing paradigm than a search one • But, this is part of the information retrieval task • Define information need, formulate “query”, examine/evaluate results, … repeat • Sensemaking • Gaining better understanding of facts at hand in order to take some next steps • A principle focus in visualanalytics • Visualization can help make large document collection more understandable more rapidly • Which is good: “Overview, zoom and filter, details on demand”
User - Task Raw Information Visual Form Dataset Views Visual Mappings View Transformations Data Transformations Recall, Visualization Pipeline: Visualization Stages • Data transformations: • Map raw data (idiosynchratic form) into data tables (relational descriptions including metatags) • Text is nominal data • A word, or any text unit, does not map easily to any quantitative representation! • The “Raw data --> Data Table” mapping is a principle element of creating any visual representation • How do you get numbers from words, sentences, …?? • Will see several solutions F -1 F Visual Perception Interaction
User - Task Raw Information Visual Form Dataset Views Visual Mappings View Transformations Data Transformations Recall, Visualization Pipeline: Visualization Stages • Visual Mappings: • Transform data tables into visual structures that combine spatial substrates, marks, and graphical properties • And … visual mappings, as well, requires at least “the usual level” of creativity F -1 F Visual Perception Interaction
Understanding Text Content • Visual representations of words, phrases, and sentences • Main goal of understanding, versus search • Visual presentation always part of text presentation – • Standard typography uses layout, font, style, color … • Electronic media, especially – pick a web page • “Single text content”
Single Text ContentWord Counts • 2012 National Conventions • NY Times: http://www.nytimes.com/interactive/2012/08/28/us/politics/convention-word-counts.html
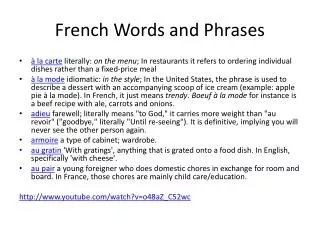
Tag / Word Clouds • Lots of popular interest • E.g., on web • Idea is to show word/concept importance through visual means • Tags: User-specified metadata (descriptors) about something • Sometimes generalized to just reflect word frequencies • Not a new technique • Milgram’s ‘76 experiment to have people label landmarks in Paris • Flanagan’s ‘97 “Search referral Zeitgeist” • Fortune’s ‘01 Money Makes the World Go Round
Tag / Word CloudsExample: US State of the Union Speeches • Guardian • http://www.guardian.co.uk/news/datablog/2011/jan/25/state-of-the-union-text-obama# • http://image.guardian.co.uk/sys-files/Guardian/documents/2011/01/26/State_of_the_union_2011.pdf?guni=Graphic:in body link
Many Eyes Tag Cloud Word pairs
Wordle“Beautiful Word Clouds”, http://www.wordle.net/ • Tightly packed words • Horizontal, vertical or diagonal • Size correlated with frequency • Multiple color palettes • User gets some control • Layout Algorithm • Details not published • Sort words by weight, decreasing order for each word • Init position randomly chosen according to distribution for target shape • Update position moves out radially
Wordle“Beautiful Word Clouds”, http://www.wordle.net/ Course schedule, table of topics, and assignments
Wordle“Beautiful Word Clouds”, http://www.wordle.net/ Course schedule, table of topics, and assignments
Wordle“Beautiful Word Clouds”, http://www.wordle.net/ Course schedule, table of topics, and assignments
Can be many variations … A bit more order Order the words more by frequency
Mani-WordleUser control • Mani-Wordle • Start with nice default algorithm • Give user more control over design • Alter color (within a palette) • Pin words, redo the rest • Move and rotate words • http://www.cg.tuwien.ac.at/courses/InfoVis/HallOfFame/2012/Gruppe03/Homepage/index.html • Koh et al TVCG (InfoVis) ‘10
Tag / Word CloudsConclusions • Weaknesses • Sub-optimal visual encoding (size vs. position) • Inaccurate size encoding (long words are bigger) • Font sizes are hard to compare • May not facilitate comparison (unstable layout) • Word frequency may not be meaningful • Most use words vs. stems • Does not show structure of the text • Studies have even shown they underperform (Gruen et al CHI ’06) • Why so popular? • OK for “quick look” • Serve as social signifiers that provide a friendly atmosphere that provide a point of entry into a complex site • Act as individual and group mirrors • Fun, not business-like
BTW - Text Analysis Toolsvoyeur: http://voyeurtools.org/ Book + tools for text analysis and visualization
Visualization and Information Retrieval • Examples so far have focused on representing a single document • …, or, really, set of words as no consideration of even word order, let alone sentence structure, etc. • Principle question is how might visual representations aid text, or document, search • I.e., how to find the proverbial needle in a haystack, where the haystack is all the documents on the www or a digital library • Term information retrieval refers to this search and its history antedates computers • IR entails: • Determine information need • Query formulation • Retrieval • Assessment of results • Reformulation of query or even information need • Repeat (until information need met)
Visualization and Information Retrieval … • IR entails: • Determine information need • Query formulation • Retrieval • Assessment of results • Reformulation of query or even information need • Repeat (until information need met) • Provide visual representations that during this process • Document collection visually, support browsing, … • Even for determining information need! • Show query results visually • Show how query terms relate to results • … any aspect
Visualization and Information Retrieval From Stasko, 2013 • Provide visual representations that during this process • Document collection visually, support browsing, … • Even for determining information need! • Show query results visually • Show how query terms relate to results • … any aspect
Evaluating Query ResultsTileBars, Hearst, 1996 • Hearst points out that query responses do not include: • How strong the match is • How frequent each term is • How each term is distributed in the document • Overlap between terms • Length of document • Document ranking is opaque • Inability to compare between results • Input limits term relationships
TileBarsOverview From Stasko, 2013 • Goal : Minimize time and effort for deciding which documents to view in detail • Show the role of the query terms in the retrieved documents, making use of document structure • Graphical representation of term distribution and overlap • Simultaneously indicate: • Relative document length • Frequency of term sets in document • Distribution of term sets with respect to the document and each other
TileBarsScreen From Stasko, 2013 TileBars screen:
TileBarsDocument representation From Stasko, 2013 Visual representation of retrieved documents Video: TileBars-80mb-chi96_05_m1.mpeg
TileBars TileBars Video
TileBarsConclusions • Clearly visually provides the information intended about each document • Ease/effort/time of comparison? • Surely would improve with use • … ?
Evaluating Query ResultsSparkler From Stasko, 2013 • Abstract result documents more • Havre et al InfoVis ‘01 • Show “distance” from query in order to give user better feel for quality of match(es) • Also shows documents in responses to multiple queries • Visualizing One Query • Triangle – query • Square – document • Distance between query and documents represents their relevance
Sparkler From Stasko, 2013 Visualizing Multiple Queries Six queries here Bullseye allows viewer to select quality results
Sparkler From Stasko, 2013 Test Example Text Retrieval Conference (TREC-3) test document collection AP news stories from June 24–30, 1990 TREC topic: Japan Protectionist Measures Sparkler found 16 of 17 relevant documents
Evaluating Query ResultsRankSpiral From Stasko, 2013 • Compare search results from different search engines • SpoerriInfoVis ’04 poster
RankSpiral From Stasko, 2013 Color represents different search engines Compare search results from different search engines
RankSpiral Color represents different search engines Compare search results from different search engines
Evaluating Query Results ResultMaps From Stasko, 2013 • Treemap-style vis for showing query results in a digital library • Clarkson, Desai & Foley TVCG (InfoVis) ‘09
Representing Multiple Documents • Previously, have seen various techniques for comparing multiple documents that are results of query, i.e., a subset of all documents • Also, may want to just show everything, and then let user do “manual search”, or user-directed search • Such displays of all documents also support the type of search common in visual analytics • Query, browse, connect, drill-down • Will see: • Parallel word clouds • Tree layout of synonyms • …
Multiple DocumentsParallel Tags Clouds • Tag clouds increase size of word as f(frequency) • Showing multiple documents as tag clouds allows visual inspection • Automated and user directed, visual analytics • Parallel Tag Clouds - name says it all • Video - Collins et al VAST ‘09 – different circuit courts • http://www.youtube.com/watch?v=rL3Ga6xBgLw
Multiple DocumentsDo different district courts differ in cases they handle? .
Multiple DocumentsDo different district courts differ in cases they handle? .
Multiple DocumentsCounting Words: Overview & Timeline • Ex., across speeches can count words • State of the Union Addresses • http://www.nytimes.com/ref/washington/20070123_STATEOFUNION.html?initialWord=iraq • NY Times demo