Download

1 / 35
400 likes | 681 Vues
Chapter 5 Capacity Planning For Products and Services. Ceiling on the amount of load Capacity at NSU. Capacity is the upper limit or ceiling on the load that an operating unit can handle. Capacity Planning. Impacts ability to meet future demands Affects operating costs

E N D
Chapter 5Capacity PlanningFor Products and Services Ceiling on the amount of load Capacity at NSU
Capacity is the upper limit or ceiling on the load that an operating unit can handle. Capacity Planning
Impacts ability to meet future demands Affects operating costs Major determinant of initial costs Involves long-term commitment Affects competitiveness Affects ease of management Globalization adds complexity Impacts long range planning Importance of Capacity Decisions Read more Find Examples …
Design capacity maximum output rate or service capacity an operation, process, or facility is designed for Effective capacity Design capacity minus allowances such as personal time, maintenance, and scrap Actual output rate of output actually achieved--cannot exceed effective capacity. Capacity
Actual output Efficiency = Effective capacity Actual output Utilization = Design capacity Efficiency and Utilization Both measures expressed as percentages
Efficiency/Utilization Example Design capacity = 50 trucks/day Effective capacity = 40 trucks/day Actual output = 36 units/day
Facilities Product and service factors Process factors Human factors Policy factors Operational factors Supply chain factors External factors Determinants of Effective Capacity
Capacity strategy for long-term demand Demand patterns Growth rate and variability Facilities Cost of building and operating Technological changes Rate and direction of technology changes Behavior of competitors Availability of capital and other inputs Strategy Formulation
Amount of capacity needed Capacity cushion (100% - Utilization) Timing of changes Need to maintain balance Extent of flexibility of facilities Key Decisions of Capacity Planning Capacity cushion – extra demand intended to offset uncertainty
Estimate future capacity requirements Evaluate existing capacity Identify alternatives Conduct financial analysis Assess key qualitative issues Select one alternative Implement alternative chosen Monitor results Steps for Capacity Planning
Long-term vs. short-term capacity needs Long-term relates to overall level of capacity such as facility size, trends, and cycles Short-term relates to variations from seasonal, random, and irregular fluctuations in demand Forecasting Capacity Requirements
Calculating Processing Requirements If annual capacity is 2000 hours, then we need three machines to handle the required volume: 5,800 hours/2,000 hours = 2.90 machines
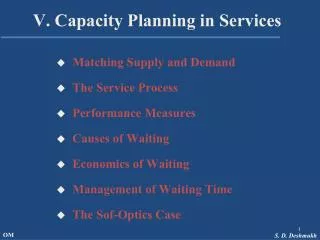
Need to be near customers Capacity and location are closely tied Inability to store services Capacity must be matched with timing of demand Degree of volatility of demand Peak demand periods Planning Service Capacity
Available capacity Expertise Quality considerations Nature of demand Cost Risk In-House or Outsourcing Outsource: obtain a good or service from an external provider
Design flexibility into systems Take stage of life cycle into account Take a “big picture” approach to capacity changes Prepare to deal with capacity “chunks” Attempt to smooth out capacity requirements Identify the optimal operating level Developing Capacity Alternatives
Bottleneck Operation Bottleneck operation: An operationin a sequence of operations whosecapacity is lower than that of theother operations 10/hr Machine #1 10/hr Machine #2 Bottleneck Operation 30/hr Machine #3 10/hr Machine #4 10/hr Figure 5.2
Machine Type A B C D E F Output 40 50 30 40 120 50 700 200 30 50 700 40 50 700 30 40 120 50
Bottleneck ? Operation 120/hr. Operation 210/hr. Operation 315/hr. __/hr. Maximum output ratelimited by bottleneck Bottleneck Operation
Economies of scale If the output rate is less than the optimal level, increasing output rate results in decreasing average unit costs Diseconomies of scale If the output rate is more than the optimal level, increasing the output rate results in increasing average unit costs Economies of Scale
Optimal Rate of Output Production units have an optimal rate of output for minimal cost. Minimum average cost per unit Average cost per unit Minimum cost 0 Rate of output Figure 5.4
Economies of Scale Minimum cost & optimal operating rate are functions of size of production unit. Small plant Average cost per unit Medium plant Large plant 0 Output rate Figure 5.5 100 250 400
Cost-volume analysis Break-even point Financial analysis Cash flow Present value Decision theory Waiting-line analysis Evaluating Alternatives
Cost-Volume Relationships Total revenue Total cost = VC + FC Amount ($) Amount ($) Total variable cost (VC) Fixed cost (FC) 0 0 Q (volume in units) Q (volume in units) Figure 5.6
Cost-Volume Relationships Profit Total revenue Amount ($) Total cost 0 BEP units Q (volume in units) Figure 5.6c
BEP Problem with Step Fixed Costs FC + VC = TC FC + VC = TC 3 machines FC + VC = TC 2 machines 1 machine Figure 5.7a 100 200 300 Quantity Step fixed costs and variable costs.
BEP Problem with Step Fixed Costs $ BEP 3 TC BEP 2 TC 3 TC 2 TR 1 Quantity Multiple break-even points Figure 5.7b
Assumptions of Cost-Volume Analysis Simple Solution to our Capacity Problem? • One product is involved • Everything produced can be sold • Variable cost per unit is the same regardless of volume • Fixed costs do not change with volume • Revenue per unit constant with volume • Revenue per unit exceeds variable cost per unit
Cash Flow - the difference between cash received from sales and other sources, and cash outflow for labor, material, overhead, and taxes. Present Value - the sum, in current value, of all future cash flows of an investment proposal. Financial Analysis
Helpful tool for financial comparison of alternatives under conditions of risk or uncertainty Suited to capacity decisions See Chapter 5 Supplement Decision Theory
Useful for designing or modifying service systems Waiting-lines occur across a wide variety of service systems Waiting-lines are caused by bottlenecks in the process Helps managers plan capacity level that will be cost-effective by balancing the cost of having customers wait in line with the cost of additional capacity Waiting-Line Analysis
Chapter 5Example 4 • Purchase 1, 2 or 3 machines • Variable cost 10/unit • Revenue 40/piece • BEP for each range? • Demand 580-660, how many to buy?
QBEP = FC/(R-v) • QBEP = $9600/($40/unit -$10/unit) = 320 unit • QBEP = $15000/($40/unit -$10/unit) = 500 unit • QBEP = $20000/($40/unit -$10/unit) = 666.67 unit • Answer part B • Demand 580-660, how many to buy?
Explain the importance of capacity planning. Discuss ways of defining and measuring capacity. Describe the determinants of effective capacity. Discuss the major considerations related to developing capacity alternatives. Briefly describe approaches that are useful for evaluating capacity alternatives Learning Objectives