Download
1 / 37
370 likes | 551 Vues
Housing in West Florida. November 16, 2006. In this part of today’s presentation, we will:. Briefly examine the impact of the base realignment on housing demand Define affordable housing and “cost burden” Examine affordable housing need estimates and projections for the region

E N D
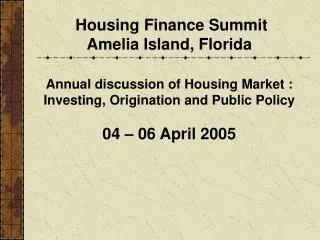
Housing in West Florida November 16, 2006
In this part of today’s presentation, we will: • Briefly examine the impact of the base realignment on housing demand • Define affordable housing and “cost burden” • Examine affordable housing need estimates and projections for the region • Discuss characteristics of the region’s housing supply
Base realignments • Eglin • Addition of 4,475 military and civilian jobs • $304 million in construction investment • Pensacola NAS • Loss of 1,600 jobs Escambia Santa Rosa Okaloosa Walton DeFuniak Springs Whiting Field Crestview Milton Eglin Air Force Base Niceville Pensacola Valparaiso Gulf Breeze Fort Walton Beach Destin Pensacola Naval Air Station
Economic impacts – jobs • Okaloosa • 7,500 additional jobs • Escambia • Loss of 2,300 jobs • Santa Rosa • 250 additional jobs • Walton • 275 additional jobs
Projecting additional households • Household impacts projected using ECFRPC DRI Housing Methodology • Estimates income for employees • Estimates headship rates for employees (eliminating those who are not the head of the household) • For employees who are the head of their household, estimates single and multi-worker households • Estimates additional income for multi-worker households
Projecting additional households • Direct and indirect impacts of the base realignments
Projecting total households, examining affordable housing need • Total households • Owners and renters • Household income • Age of householder • Cost burden
What is housing“cost burden?” • Households are considered cost burdened if housing related costs exceed 30 percent of gross income. • Households who pay more than 30 percent of their gross income for housing may have difficulty affording other necessities such as food, child care, transportation and health care.
Renter- or owner-occupied housing is affordable if these items total no more than 30% of gross income: • Mortgage payment, including: • Principal • Interest • Taxes • Insurance • Condominium fees or manufactured housing costs • Electric • Gas • Water & Sewer
Affordable Housing Need • A common measure of housing need is the number of cost burdened households • Besides cost burden the other major component of affordable housing need estimates is household income: • defined as a percentage of area median income (AMI) and adjusted for household size • These components and their definitions are related to program eligibility requirements
The need for affordable housing is frequently discussed using these income levels: • Moderate income: 80-120% AMI ($63,050)* • Low income: 50-80% AMI ($42,050)* • Very low income: 30-50% AMI ($26,300)* • Extremely low income: less than 30% AMI ($15,750)* • 60% AMI ($31,550)* is a typical level for Florida Housing’s rental programs *income limit for 4-person household using the 2005 State Median of $52,550
and these cost burden levels: • The conventional threshold of more than 30% • Severe cost burden, more than 50% (DCA summary indicator) • Florida Housing’s threshold of 40% • The choice of a level has significant implications for numerical goals
Cost burden • Cost burdened households: households spending more than 30% of their income for housing • In 2005: Percent of all households that were cost-burdened and earned 60% or less of median income • Okaloosa 17.5% (9th in state) • Escambia 17.5% (10th in state) • Santa Rosa 14.1% (45th in state) • Walton 12.6% (63rd in state)
Cost burden • In 2005: Percent of renter households that were cost-burdened and earned 60% or less of AMI • Escambia 31.8% (10th in state) • Santa Rosa 31.4% (16th in state) • Okaloosa 30.1% (28th in state) • Walton 27.6% (47th in state) • In 2005: Percent of owner households that were cost-burdened and earned 60% or less of AMI • Okaloosa 11.1% (31st in state) • Escambia 10.5% (39th in state) • Santa Rosa 10.0% (52nd in state) • Walton 09.0% (64th in state)
Cost burden and income • In 2005 the 4 county region has an estimated 24,000 low income, severely cost burdened households (almost evenly split between owners and renters). • By 2030 that number will grow by 14,000 households. • Between 2005 and 2030 the number of households with incomes less than 60% AMI will grow by 44,000
Special Population Groups • These groups may be disproportionately represented or may not be incorporated in estimates: • Elderly • Farmworkers • Homeless People • Persons with Disabilities
Public Housing – 4 County summary • There are approximately 1,300 public housing units and over 3,700 Housing Choice (Sec. 8) vouchers. • Two of the largest Authorities, Pensacola and Ft. Walton, have waiting lists of approximately 1,500 households for Housing Choice vouchers (2004 survey data).
Assisted Housing Supply – 4 County summary • There are 4,661 assisted housing units in the 4 county region. • Of these, 2,723 units have HUD or Rural Development rental assistance. • Preservation: in Escambia County, for example, there are over 700 units in assisted properties which have terminated HUD mortgages, or RD or FHFC restrictive use/income or rent restrictions that expire by 2010.
Housing supply • Impact of hurricanes • Building activity, 2000-2006 • Seasonal housing • Affordability/cost burden • Home sales
Hurricanes • Estimated damage from hurricanes: several thousand residential units • Hurricane recovery funding • Labor and material shortages
Hurricanes (3) • Hurricane housing recovery plans
Building activity • Between 2000 and July 2006, 48,993 permits issued • Escambia 14,208 • Okaloosa 13,068 • Santa Rosa 09,736 • Walton 11,981 • Type • Single family 37,291 (76%) • Multifamily 11,702 (24%)
Seasonal housing • In 2000, 40% of vacant units in West Florida were seasonal • Escambia 25% • Okaloosa 36% • Santa Rosa 23% • Walton 63%
Home prices, 2000-2005(Florida Association of Realtors MLS data) • In the Fort Walton Beach MSA, the median sale price rose by 97% • In the Pensacola MSA, the median sale price rose by 60%
How rising prices relative to income have reduced affordability – comparing 2000 with 2005 in Santa Rosa
How rising prices relative to income have reduced affordability – comparing 2000 with 2005 in Santa Rosa
How rising prices have reduced availability 2000 – 2005 in Okaloosa County
Rental unit at HUD estimated Fair Market Rent • In Pensacola MSA, the Fair Market Rent (FMR) for a two-bedroom apartment is $579. In order to afford this level of rent and utilities, without paying more than 30% of income on housing, a household must earn $23,160 annually (a very low income household). • Assuming a 40-hour work week, 52 weeks per year, this level of income translates into a Housing Wage of $11.13.
Summary • Hurricanes damaged housing, exacerbated existing labor and material shortages and reduced the supply of affordable housing • West Florida experienced rapid home price increases between 2000-2005 • Percent of cost burdened households increased in all 4 counties between 1990 and 2000 • Trend in affordability of homes sold was downward between 2003 and 2006 in all counties • Homes are over-valued in most Florida MSAs • Sales prices of single family homes and condos are now trending downward
Housing and transportation New York Tampa 37.6% 37.3% 15.4% 20.4% 53.0% 57.7%
Links and Contact: • Florida Housing Data Clearinghouse: • www.flhousingdata.shimberg.ufl.edu • www.shimberg.ufl.edu • Florida Housing Coalition • www.flhousing.org • Contact information: Bill O’Dell 352-273-1171 billo@ufl.edu