Download
1 / 6
60 likes | 181 Vues
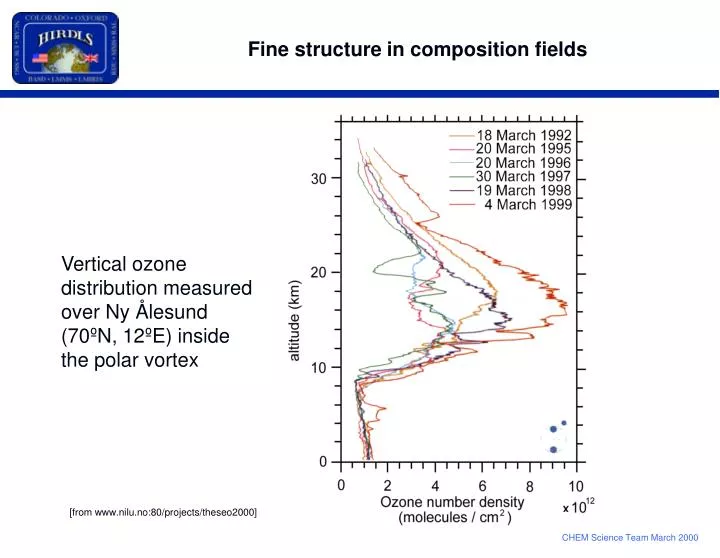
Fine structure in composition fields. Vertical ozone distribution measured over Ny Ålesund (70ºN, 12ºE) inside the polar vortex. [from www.nilu.no:80/projects/theseo2000]. Importance of modelling dynamics correctly. Modelled ClONO 2 fields - strong mixing results in less ClO to destroy ozone.

E N D
Fine structure in composition fields Vertical ozone distribution measured over Ny Ålesund (70ºN, 12ºE) inside the polar vortex [from www.nilu.no:80/projects/theseo2000]
Importance of modelling dynamics correctly Modelled ClONO2 fields - strong mixing results in less ClO to destroy ozone [Figures from UGAMP]
Gravity wave observations from CRISTA S.D.Eckermann & P.Preusse, Science, 286, 19 November 1999, 1534-1537.
Gravity wave observations from CRISTA Predicted vertical wavelength (lz) theory versus measured(lz) over South America at 20-30 km in November 1998 [Eckermann, Science 286, 1999].
Consistent vertical and horizontal resolution Vertical and horizontal resolutions for satellite sounders and numerical models [see Lindzen and Fox-Rabinovitz, Mon.Wea.Rev. 117, 2575-2583]
Simulations of low and high horizontal resolution Simulation of N2O on the 2100 K isentropic surface from the SLIMCAT model (4 ppb contour interval). Below: gridded simulated ISAMS and HIRDLS observations for modelled field for a 12 hour window centred on the observation time. [Figure from Alan Iwi]