Download
1 / 23
240 likes | 431 Vues
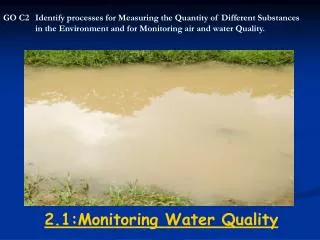
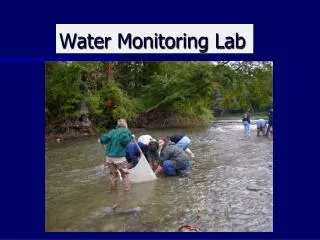
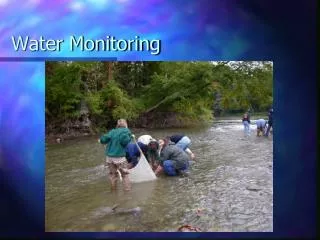
Water Monitoring. What/Why ?. Water testing Identifying water content Allows scientists to have a full understanding of what is affecting their stream or river. How?. Physical Tests Chemical Tests. 1: pH Level:. The pH level tells us how acidic or basic our water.

E N D
What/Why? • Water testing • Identifying water content • Allows scientists to have a full understanding of what is affecting their stream or river.
How? • Physical Tests • Chemical Tests
1: pH Level: • The pH level tells us how acidic or basic our water. • The pH range is 0 to 14 with 7 being neutral. • While a range of 6.5 to 8.2 is optimal for most organisms
How to test the pH Fill the test tube to the 10ml line. Add one pH tablet. Cap the tube and mix to dissolve tablet. Compare the color of the sample to the pH color chart. Record result as pH. pH 4 1 poor pH 5 1 poor pH 6 3 good pH 7 4 excellent pH 8 3 good pH 9 1 poor pH 10 1 poor pH 11 1 poor
2. Temperature • How hot or cold the water is • Colder water can hold more dissolved oxygen than warmer water.
How to take the Temperature Place the thermometer 4 inches below the surface of the water for 1 minute. (in a river) Remove the thermometer and record the results in degrees Celsius.
3: Dissolved Oxygen • The oxygen amount in the water. • Used by fish and other organisms to breathe • Fast moving water has more dissolved oxygen than slow, stagnant water
How to test the Dissolved Oxygen Fill the test tube to the top of the tube with sample water. Add two Dissolved Oxygen tablets to the test tube. Cap the tube. Make sure no air bubbles are in the sample. Invert until the tablets dissolve (4 minutes) Wait 5 minutes Compare the color of the sample to the Dissolved Oxygen chart. Record result in units ppm (parts per million).
Dissolved Oxygen and Temperature chart Dissolved Oxygen 0 ppm 4 ppm 8ppm 2 C 0 29 58 4 C 0 31 61 6 C 0 32 64 8 C 0 34 68 10 C 0 35 71 12 C 0 37 74 14 C 0 39 78 16 C 0 41 81 18 C 0 42 84 20 C 0 44 88 22 C 0 46 92 24 C 0 48 95 26 C 0 49 99 28C 0 51 102 30 C 0 53 106 Dissolved Oxygen % saturation score 91-110% 4 excellent, 71-90% 3 good, 51-70% 2 fair, <50% 1 poor
4: Turbidity • Turbidity is the measure of how clear the water is. • Caused by suspendedsediments such as clay, silt, organic and inorganic matter. • (Turbidity should not be confused with color since darkly colored water can still be clear and not turbid). Tributary of Goose Creek, May 13, 2008
How to test the Turbidity of the water Fill the turbidity tube to the line. Place the base of the tube on the outline on the Turbidity Chart. Look down through the sample water at the Secchi disk icon under the tube. Compare the appearance of the Secchi disk icon under the tube to the gray Secchi disk on either side of the tube to determine the turbidity. Record the units in JTU (Jackson Turbidity Units) JTU Score 0 4 excellent 0 to 40 3 good 40 to 100 2 fair >100 1 poor
5: Phosphates • Phosphorus is a nutrient that acts as a fertilizer for marine plants. • Over half of the phosphates in lakes, streams, and rivers comes from detergents.
How to test for Phosphates Fill the test tube to the 5ml line. Add one Phosphorus tablet. Cap the tube and mix until the tablet has disintegrated. Wait 5 minutes. Compare the color of the sample to the Phosphate color chart. Record result in Phosphate ppm. Phosphate ppm Score 4 excellent 3 good 4 2 fair
6: Coliform Bacteria (Feces!) • Fecal Coliform Bacteria is naturally present in the human digestive tract but is rare in unpolluted waters. • Its presence in water serves as an indication of sewagecontamination.
How to test for Coliform Bacteria Fill the tube to the 10 ml line. Replace the cap. Stand the tube upright, with tablet flat on the bottom of the tube. Incubate the tube upright at room temperature for 48 hours. Store out of direct sunlight. Compare the contents of the tube to the Coliform Bacteria Color Chart. Test Results Score Negative 3 good Positive 1 poor
7: Nitrogen Content • Nitrogen is a nutrient that acts as a fertilizer for aquatic plants. • Nitrogen enters the water from human and animal waste, decomposing organic matter, and lawn and crop fertilizer run-off.
How to test the Nitrogen content Fill the test tube to the 5 ml line. Add one #1 nitrate tablet. Cap the tube and mix until the tablet has disintegrated. Add one #2 nitrate tablet. Cap the tube and mix until the tablet has disintegrated. Wait 5 minutes. Compare the color of sample to the Nitrate Color Chart. Record the result as ppm Nitrate (parts per million) If reaction is yellow record 0 ppm. Nitrate (ppm) Score 2 fair 1 poor 40 1 poor
Invertebrates • Invertebrates (animals without backbones) are a natural and important part of any natural water body. • By identifying which species are found, we can accurately determine the overall health of a stream or river.
Sources: http://www2.lakecountyohio.org/soil/Construction%20pages/Monitoring.JPG http://www.swimfix.co.uk/data/uploads/860.JPG http://h2o.enr.state.nc.us/nps/images/Cow's%20in%20stream%20.jpg http://www.orau.org/ptp/collection/consumer%20products/fertilizer.jpg http://www.epa.gov/gmpo/archive/wwmonitor/images/hancock-4.jpg http://www.epa.gov/gmpo/archive/wwmonitor/images/hancock-4.jpg http://www.epa.gov/history/images/p10b.gif http://www.pmel.noaa.gov/foci/ice07/imagesOfTheDay/Benthic-invertebrates.jpg http://www.epa.gov/reg3wapd/nps/education/equipment.htm