1 / 1

Beförderung chemischer Erzeugnisse 2012* nach Verkehrsträgern in Prozent

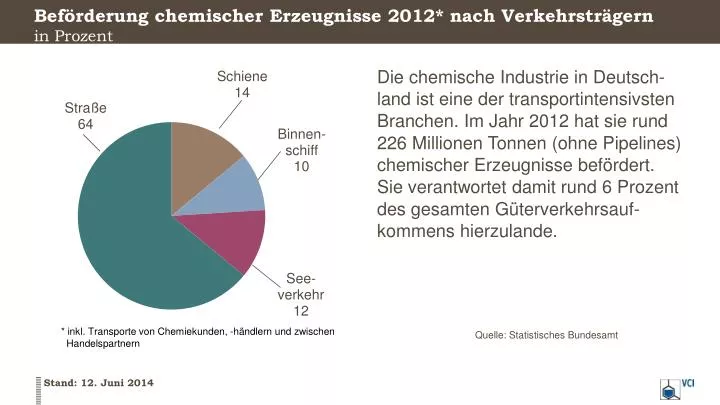
Beförderung chemischer Erzeugnisse 2012* nach Verkehrsträgern in Prozent.

glyn
Télécharger la présentation

Beförderung chemischer Erzeugnisse 2012* nach Verkehrsträgern in Prozent

An Image/Link below is provided (as is) to download presentation Download Policy: Content on the Website is provided to you AS IS for your information and personal use and may not be sold / licensed / shared on other websites without getting consent from its author. Content is provided to you AS IS for your information and personal use only. Download presentation by click this link. While downloading, if for some reason you are not able to download a presentation, the publisher may have deleted the file from their server. During download, if you can't get a presentation, the file might be deleted by the publisher.

E N D

Presentation Transcript


  1. Beförderung chemischer Erzeugnisse 2012* nach Verkehrsträgernin Prozent • Die chemische Industrie in Deutsch-land ist eine der transportintensivsten Branchen. Im Jahr 2012 hat sie rund 226 Millionen Tonnen (ohne Pipelines) chemischer Erzeugnisse befördert. Sie verantwortet damit rund 6 Prozent des gesamten Güterverkehrsauf-kommens hierzulande. * inkl. Transporte von Chemiekunden, -händlern und zwischenHandelspartnern Quelle: Statistisches Bundesamt

More Related