Download
1 / 19
190 likes | 215 Vues
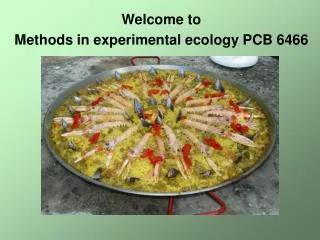
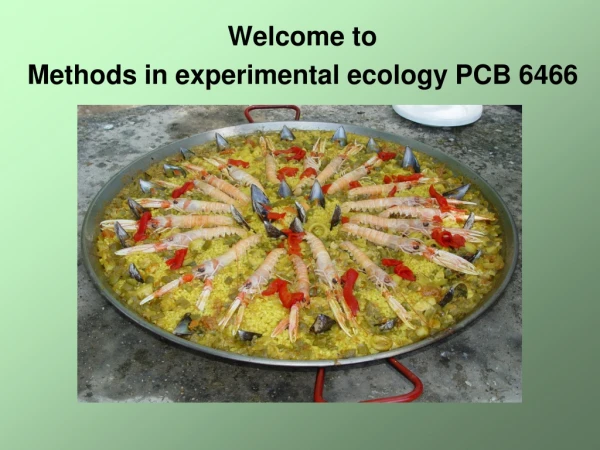
Welcome to the Methods in Experimental Ecology course. This course is based on ecological statistics, statistics in R, and Bayesian methods in ecology. The course consists of exercises, exams, and a final. Communication etiquette and submission guidelines are provided. An example analysis of the association between Florifacies mirabilia and Thorny plant (Opuntia sp.) is included.

E N D
Instructors: • Lina Sánchez Clavijo, Office: Biology Bldg. 409 lina.sanchez@knights.ucf.eduOffice hours: • Pedro F. Quintana-Ascencio, Office: Biology Bldg. 401 Epedro.quintana-ascencio@ucf.edu Office hours : by appointment With the participation of: Matthew Tye
Link to course web site • http://pascencio.cos.ucf.edu/ Course Based on: • Gotelli, N. J & A.M. Ellison. 2004. A primer of ecological statistics. Sinauer. • Crawley, M.J. 2005. Statistics: an introduction using R. • McCarthy, M. 2007. Bayesian methods in ecology. Cambridge.
Performance Evaluation: 13 exercises. We only consider the 10 best (5 points each) = 5 x 10 =50 Two exams: content cumulative (15 points each) 15 x 2 = 30 Final (20 points) Total 50 + 30 + 20 = 100 Grade scale: A = 90-100; B = 80-89; C = 70-79; D = 60-69; F= below 60
Etiquette for communication • Do not wait to the last minute. There will not be any response to questions within 24 hours before homework or exam due date. • We like our weekends, please no e-mails on Saturday and Sundays. We will respond first come first served on Monday
Exercises • E-mail a single Word document with your results. All analytical work needs to be done in R (unless otherwise noted). Scripts and output from R should be included in the Word document for full credit. • They will be due a week from the day they are assigned. No assignments will be accepted after the start of the class on due date
Species correlates of Florifacies mirabila in playa linda Pedro Quintana-Ascencio Universidad de Cancun, Yucatan, Mexico
Florifacies mirabila Small mammal Feed on insects. It has glandules around the mouth producing a sweet secretion that attract plant pollinators. It is extremely sedentary Endemic to the Yucatan peninsula
Objective • To evaluate the association between Florifacies and Thorny plant (Opuntia sp.) Hypothesis • Because both have flower like structures Florifacies and Thorny plant will be positively associated
Methods • I established 59 1 x 2 m plots • I counted every individual of Florifacies and Thorny plant (Opuntia sp.) within the plot • Data was entered in Excel and analyzed with SPSS software
Nice Palms Quadrats Pedro Florifacies mirabila Thorny plant Sampling design
Are Florifacies and Thorny associated ? Likelihood ratio = 10.155, d.f.= 1, Asymptotic significance (2 sided)=0.001 3 cells (75.0%) have expected count less than 5. The minimum expected count is .17
Do Florifacies density correlates with thorny plant density? How? Florifacies density N=59 quadrats
Conclusions • Florifacies and Thorny plant (Opuntia sp.) are associated (P=0.001) • Their densities are are positively correlated (P<0.001) • My hypothesis was correct
What is wrong? • Do you agree with this conclusions? • Is the experimental design acceptable? • Is the analysis correct?
How can we access this door? Experimental design and Data Analysis