Download
1 / 122
1.22k likes | 1.57k Vues
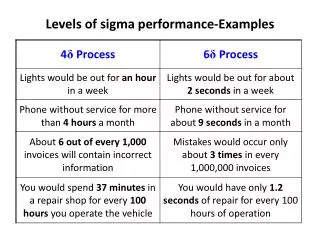
More Examples of Interpreting Wait Events To Boost System Performance. Roger Schrag and Terry Sutton Database Specialists, Inc. www.dbspecialists.com. Session Objectives. Briefly introduce wait events: Define wait events Discuss how to use the wait event interface

E N D
More Examples of Interpreting Wait Events To Boost System Performance Roger Schrag and Terry Sutton Database Specialists, Inc. www.dbspecialists.com
Session Objectives Briefly introduce wait events: Define wait events Discuss how to use the wait event interface Walk through five examples of how wait event information was used to troubleshoot production problems
“Wait Event” Defined We say an Oracle process is “busy” when it wants CPU time. When an Oracle process is not busy, it is waiting for something to happen. There are only so many things an Oracle process could be waiting for, and the kernel developers at Oracle have attached names to them all. These are wait events.
Wait Event Examples An Oracle process waiting for the client application to submit a SQL statement waits on a “SQL*Net message from client” event. An Oracle process waiting on another session to release a row-level lock waits on an “enqueue” event.
Wait Event Interface • Each Oracle process identifies the event it is waiting for each time a wait begins. • The instance collects cumulative statistics about events waited upon since instance startup. • You can access this information through v$ views and a wait event tracing facility. • These make up the wait event interface.
Viewing Wait Events http://dbrx.dbspecialists.com/pls/dbrx/view_report
Why Wait Event Information Is Useful Wait events touch all areas of Oracle—from I/O to latches to parallelism to network traffic. Wait event data can be remarkably detailed. “Waited 0.02 seconds to read 8 blocks from file 42 starting at block 18042.” Analyzing wait event data will yield a path toward a solution for almost any problem.
Important Wait Events • There were 158 wait events in Oracle 8.0. • There are 363 wait events in Oracle 9i Release 2 (9.2.0). • Most come up infrequently or are rarely significant for troubleshooting performance. • Different wait events are significant in different environments, depending on which Oracle features have been deployed.
A Few Common Events buffer busy waits library cache load lock control file parallel write library cache pin control file sequential read log buffer space db file parallel read / write log file parallel write db file scattered read log file sequential read db file sequential read log file switch completion direct path read / write log file sync enqueue undo segment extension free buffer waits write complete waits latch free
Idle Events Sometimes an Oracle process is not busy simply because it has nothing to do. In this case the process will be waiting on an event that we call an “idle event.” Idle events are usually not interesting from the tuning and troubleshooting perspective.
Common Idle Events client message PX Deq: Execute Reply dispatcher timer PX Deq: Execution Msg gcs for action PX Deq: Signal ACK gcs remote message PX Deq: Table Q Normal ges remote message PX Deque wait i/o slave wait PX Idle Wait jobq slave wait queue messages lock manager wait for remote message rdbms ipc message null event slave wait parallel query dequeue smon timer pipe get SQL*Net message from client PL/SQL lock timer SQL*Net message to client pmon timer SQL*Net more data from client PX Deq Credit: need buffer virtual circuit status PX Deq Credit: send blkd wakeup time manager
Accounted for by the Wait Event Interface Time spent waiting for something to do (idle events) Time spent waiting for something to happen so that work may continue (non-idle events)
Not Accounted for by the Wait Event Interface Time spent using a CPU Time spent waiting for a CPU Time spent waiting for virtual memory to be swapped back into physical memory Time spent on CPU-intensive activities: Logical reads Spinning while waiting for latches Statement parsing
Timed Statistics Enable timed statistics dynamically at the instance or session level: ALTER SYSTEM SET timed_statistics = TRUE; ALTER SESSION SET timed_statistics = TRUE; Enable timed statistics at instance startup by setting the instance parameter: timed_statistics = true The wait event interface will not collect timing information unless timed statistics are enabled.
The Wait Event Interface Dynamic performance views v$system_event v$session_event v$event_name v$session_wait Wait event tracing
The v$system_event View Shows one row for each wait event name, along with cumulative statistics since instance startup. Wait events that have not occurred at least once since instance startup do not appear in this view. Column Name Data Type -------------------------- ------------ EVENT VARCHAR2(64) TOTAL_WAITS NUMBER TOTAL_TIMEOUTS NUMBER TIME_WAITED NUMBER AVERAGE_WAIT NUMBER TIME_WAITED_MICRO NUMBER
Columns In v$system_event EVENT: The name of a wait event TOTAL_WAITS: Total number of times a process has waited for this event since instance startup TOTAL_TIMEOUTS: Total number of timeouts while waiting for this event since instance startup TIME_WAITED: Total time waited for this wait event by all processes since startup (in centiseconds) AVERAGE_WAIT: The average length of a wait for this event since instance startup (in centiseconds) TIME_WAITED_MICRO: Same as TIME_WAITED but in microseconds (Oracle 9i)
Sample v$system_event Query SQL> SELECT event, time_waited 2 FROM v$system_event 3 WHERE event IN ('smon timer', 4 'SQL*Net message from client', 5 'db file sequential read', 6 'log file parallel write'); EVENT TIME_WAITED --------------------------------- ----------- log file parallel write 159692 db file sequential read 28657 smon timer 130673837 SQL*Net message from client 16528989
The v$session_event View Shows one row for each wait event name within each session, along with cumulative statistics since session start. Column Name Data Type -------------------------- ------------ SID NUMBER EVENT VARCHAR2(64) TOTAL_WAITS NUMBER TOTAL_TIMEOUTS NUMBER TIME_WAITED NUMBER AVERAGE_WAIT NUMBER MAX_WAIT NUMBER TIME_WAITED_MICRO NUMBER
Columns In v$session_event SID: The ID of a session (from v$session) EVENT: The name of a wait event TOTAL_WAITS: Total number of times this session has waited for this event TOTAL_TIMEOUTS: Total number of timeouts while this session has waited for this event TIME_WAITED: Total time waited for this event by this session (in centiseconds) AVERAGE_WAIT: The average length of a wait for this event in this session (in centiseconds) MAX_WAIT: The maximum amount of time the session had to wait for this event (in centiseconds)
Sample v$session_event Query SQL> SELECT event, total_waits, time_waited_micro 2 FROM v$session_event 3 WHERE SID = 4 (SELECT sid FROM v$session 5 WHERE audsid = 6 USERENV ('sessionid') ); EVENT WAITS TIME_WAITED_MICRO --------------------------- ----- ----------------- db file sequential read 552 2409173 db file scattered read 41 315928 SQL*Net message to client 73 347 SQL*Net message from client 72 3397382712
Oracle 9i Bug #2429929 SQL> SELECT event, total_waits, time_waited_micro 2 FROM v$session_event 3 WHERE SID + 1 = 4 (SELECT sid FROM v$session 5 WHERE audsid = 6 USERENV ('sessionid') ); EVENT WAITS TIME_WAITED_MICRO --------------------------- ----- ----------------- db file sequential read 552 2409173 db file scattered read 41 315928 SQL*Net message to client 73 347 SQL*Net message from client 72 3397382712
The v$event_name View Shows one row for each wait event name known to the Oracle kernel, along with names of up to three parameters associated with the wait event. Column Name Data Type -------------------------- ------------ EVENT# NUMBER NAME VARCHAR2(64) PARAMETER1 VARCHAR2(64) PARAMETER2 VARCHAR2(64) PARAMETER3 VARCHAR2(64)
Columns In v$event_name EVENT#: An internal ID NAME: The name of a wait event PARAMETERn: The name of a parameter associated with the wait event
Sample v$event_name Query SQL> SELECT * 2 FROM v$event_name 3 WHERE name = 'db file scattered read'; EVENT# NAME ---------- ------------------------------ PARAMETER1 PARAMETER2 PARAMETER3 ------------- ------------- ------------- 95 db file scattered read file# block# blocks
The v$session_wait View Shows one row for each session, providing detailed information about the current or most recent wait event. Column Name Data Type -------------------------- ------------ SID NUMBER SEQ# NUMBER EVENT VARCHAR2(64) P1TEXT VARCHAR2(64) P1 NUMBER P1RAW RAW(4) P2TEXT VARCHAR2(64) P2 NUMBER P2RAW RAW(4) P3TEXT VARCHAR2(64) P3 NUMBER P3RAW RAW(4) WAIT_TIME NUMBER SECONDS_IN_WAIT NUMBER STATE VARCHAR2(19)
Columns In v$session_wait SID: The ID of a session SEQ#: A number that increments by one on each new wait STATE: An indicator of the session status: ‘WAITING’: The session is currently waiting, and details of the wait event are provided. ‘WAITED KNOWN TIME’: The session is not waiting, but information about the most recent wait is provided. ‘WAITED SHORT TIME’ or ‘WAITED UNKNOWN TIME’: The session is not waiting, but partial information about the most recent wait is provided.
Columns In v$session_wait (cont.) EVENT: The name of a wait event PnTEXT: The name of a parameter associated with the wait event Pn: The value of the parameter in decimal form PnRAW: The value of the parameter in raw form WAIT_TIME: Length of most recent wait (in centiseconds) if STATE = ‘WAITED KNOWN TIME’ SECONDS_IN_WAIT: How long current wait has been so far if STATE = ‘WAITING’
Sample v$session_wait Query SQL> SELECT * FROM v$session_wait WHERE sid = 16; SID SEQ# EVENT ---- ----- ------------------------------ P1TEXT P1 P1RAW P2TEXT P2 P2RAW ------ ---- -------- ------ ---- -------- P3TEXT P3 P3RAW WAIT_TIME SECONDS_IN_WAIT ------ ---- -------- --------- --------------- STATE ------------------- 16 303 db file scattered read file# 17 00000011 block# 2721 00000AA1 blocks 8 00000008 -1 0 WAITED SHORT TIME
Tracing Wait Event Activity Methods for setting debug events: ALTER SESSION SET events oradebug dbms_system.set_ev Using the dbms_support package or setting debug event 10046 enables SQL trace, and can optionally include wait event information and bind variable data in trace files as well.
Activating Wait Event Tracing • dbms_support is missing from many releases of Oracle 8i, but is available as a patch. • dbms_support is not installed by default; run dbmssupp.sql in ?/rdbms/admin to install it. • dbms_system.set_ev is not supported by Oracle Corporation because it lets you set any debug event and some can put your database at risk. • Tracing imposes serious system overhead, so trace only what you need.
Debug Event 10046 Settings ALTER SESSION SET events '10046 trace name context forever, level N';
Sample Oracle 8i Trace Output ===================== PARSING IN CURSOR #1 len=80 dep=0 uid=502 oct=3 lid=502 tim=2293771931 hv=2293373707 ad='511dca20' SELECT /*+ FULL */ SUM (LENGTH(notes)) FROM customer_calls WHERE status = :x END OF STMT PARSE #1:c=0,e=0,p=0,cr=0,cu=0,mis=1,r=0,dep=0,og=0,tim=2293771931 BINDS #1: bind 0: dty=2 mxl=22(22) mal=00 scl=00 pre=00 oacflg=03 oacfl2=0 size=24 offset=0 bfp=09717724 bln=22 avl=02 flg=05 value=43 EXEC #1:c=0,e=0,p=0,cr=0,cu=0,mis=0,r=0,dep=0,og=4,tim=2293771931 WAIT #1: nam='SQL*Net message to client' ela= 0 p1=675562835 p2=1 p3=0 WAIT #1: nam='db file scattered read' ela= 3 p1=17 p2=923 p3=8 WAIT #1: nam='db file scattered read' ela= 1 p1=17 p2=931 p3=8 WAIT #1: nam='db file scattered read' ela= 2 p1=17 p2=939 p3=8 WAIT #1: nam='db file sequential read' ela= 0 p1=17 p2=947 p3=1 WAIT #1: nam='db file scattered read' ela= 3 p1=17 p2=1657 p3=8
Wait Event Tracing Enhancements In Oracle 9i • The dbms_support package is provided for easier trace activation. • Elapsed times in the trace file are shown in microseconds instead of centiseconds. • A “waits=yes” option has been added to TKPROF to include wait event statistics in the TKPROF report.
Using Wait Event Information Five examples of how wait event information was used to diagnose production problems
Example #1: Buffer Busy Waits A magazine publisher has a website that displays content stored in a database. At times the website would get bogged down—response time would become poor and the database server would become extremely busy (near-zero idle time).
Viewing Wait Events Statistics With Statspack Collect Statspack snapshots at regular intervals. Statspack report shows top wait events for entire instance during snapshot interval. Oracle 9i Statspack also shows CPU time used during the interval.
Statspack Report Output Snap Id Snap Time Sessions ------- ------------------ -------- Begin Snap: 61 11-Dec-02 13:00:52 145 End Snap: 71 11-Dec-02 14:00:26 145 - - - - - - - - - - - - - - - - - - - - - - - - - - - - - - Top 5 Wait Events ~~~~~~~~~~~~~~~~~ Wait % Total Event Waits Time (cs) Wt Time ------------------------ ---------- ---------- ------- buffer busy waits 1,962,372 1,278,649 50.03 db file sequential read 1,336,870 1,050,878 41.12 db file scattered read 47,717 49,326 1.93 direct path write 8,070 40,574 1.59 latch free 38,220 31,012 1.21
What We See in the Statspack Report Dominant wait events: buffer busy waits db file sequential read Over 23,000 seconds of wait time on these two events in a one hour period (over 6 seconds of waiting per elapsed second)
Understanding the Buffer Busy Waits Event SQL> SELECT parameter1, parameter2, parameter3 2 FROM v$event_name 3 WHERE name = 'buffer busy waits'; PARAMETER1 PARAMETER2 PARAMETER3 ------------ ------------ ------------ file# block# id file#: Data file containing the desired data block block#: Block within the data file that is desired id: Reason the buffer in the buffer cache is busy (see Metalink bulletin #34405.1)
Finding Which Data Blocks Are Experiencing Buffer Contention SQL> SELECT sid, event, state, seconds_in_wait, 2 wait_time, p1, p2, p3 3 FROM v$session_wait 4 WHERE event = 'buffer busy waits' 5 ORDER BY sid; SID EVENT STATE SEC TIME P1 P2 P3 --- ----------------- ----- --- ---- ----- ----- ----- 12 buffer busy waits WAITE 1 0 30 62157 130 31 buffer busy waits WAITE 1 0 30 23558 130
Finding Which Data Blocks Are Experiencing Buffer Contention SQL> SELECT owner, segment_name, segment_type 2 FROM dba_extents 3 WHERE file_id = &absolute_file_number 4 AND &block_number BETWEEN block_id 5 AND block_id + blocks -1; Enter value for absolute_file_number: 30 Enter value for block_number: 62157 OWNER SEGMENT_NAME SEGMENT_TYPE ----------------- ------------------- ------------ PRODMGR SAMPLES TABLE
What We Have Learned So Far A buffer containing a data block of the SAMPLES table is experiencing contention. The buffer in the buffer cache is busy because another session is reading the same data block from disk.
Understanding the DB File Sequential Read Event SQL> SELECT parameter1, parameter2, parameter3 2 FROM v$event_name 3 WHERE name = 'db file sequential read'; PARAMETER1 PARAMETER2 PARAMETER3 ------------ ------------ ------------ file# block# blocks file#: Data file containing the desired data block block#: Block within the data file that is desired blocks: How many blocks are being read (typically 1 for db file sequential read)
Finding Which Data Blocks Are Being Read SQL> SELECT sid, event, state, seconds_in_wait, 2 wait_time, p1, p2, p3 3 FROM v$session_wait 4 WHERE event = 'db file sequential read' 5 ORDER BY sid; SID EVENT STATE SEC TIME P1 P2 P3 --- ----------------- ----- --- ---- ----- ----- ----- 17 db file sequentia WAITE 1 0 30 62042 1 19 db file sequentia WAITE 1 0 30 61731 1 33 db file sequentia WAITI 0 0 30 57292 1
Finding Which Data Blocks Are Being Read SQL> SELECT owner, segment_name, segment_type 2 FROM dba_extents 3 WHERE file_id = &absolute_file_number 4 AND &block_number BETWEEN block_id 5 AND block_id + blocks -1; Enter value for absolute_file_number: 30 Enter value for block_number: 62042 OWNER SEGMENT_NAME SEGMENT_TYPE ----------------- ------------------- ------------ PRODMGR SAMPLES TABLE
The SAMPLES Table Contained a LONG column with very large values Excessive row chaining Most queries did not retrieve the LONG data Table assigned to KEEP pool, but too large to fit entirely in memory
Long-Term Problem Resolution Convert the LONG column to a CLOB. Large CLOB data will be stored in a separate LOB segment. Row chaining will be reduced or eliminated. The table segment will be much smaller and more likely to fit in memory.
Short-Term Problem Resolution Added index on most columns of SAMPLES table Allowed most queries to avoid table segment Enlarged KEEP pool Allowed index segment to fit in memory