Download
1 / 27
270 likes | 384 Vues
This work aims to reconstruct cellular regulatory networks by modeling mRNA expression data. It distinguishes between various network semantics, including Boolean and probabilistic models, and uses realistic biochemical frameworks to understand transcription rates. The approach considers hidden variables, such as regulator activities and mRNA decay rates, to infer the dynamics of gene regulation. By applying techniques like gradient ascent and hill climbing for structure learning, this research seeks to unravel complex gene interactions and their impacts on cellular function and behavior.

E N D
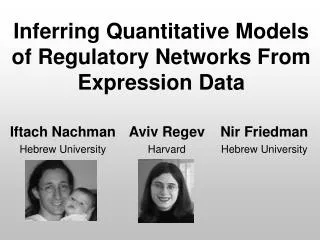
Inferring Quantitative Models of Regulatory Networks FromExpression Data Aviv Regev Harvard Nir Friedman Hebrew University Iftach Nachman Hebrew University
Conditions Genes • Common approach: • Interaction Networks • Different semantics for networks • Boolean, probabilistic, differential equations, … Biocarta. http://www.biocarta.com/ Goal: Reconstruct Cellular Networks • Structure • Function • Dynamics
Activation signal A Major Assumption… mRNA mRNA protein TF TF TF active protein TF mRNA tr. rate G G G mRNA degradation Hidden Observed
Activation signal TF G Realistic Regulation Modeling mRNA protein • Model the closest connection • Active protein levels are not measured • Transcript rates are computed from expression data and mRNA decay rates • Realistic biochemical model of transcription rates TF TF active protein Hidden mRNA tr. rate G Observed mRNA degradation Hidden Observed
TF TF G G P( )• Avg rate = + P( )• Modeling Transcription Rate Simplest case: one activator On Off mRNA transcripts On [McAdams & Arkin, 1997; Ronen et al, 2002]
TF b d G Modeling Transcription Rate Concentration of TF Steady state equations: Concentration of bound promoters Concentration of free promoters
TF b d G TF activity = 250 = 20 Trans rate = 4 = 1 Time Modeling Transcription Rate = 250 = 4 = 20 Transcription rate = 1 TF activity Time
1 P(State) TF a G b TF1 TF2 G c 2 d General Two Regulator Function X Similar models for other modes of binding: • Competitive binding • Cooperative binding [Buchler et al, 2003; Setty et al, 2002]
P(State) P(State) aa X a ab X ac X b TF1 TF2 ad X G c d General Two Regulator Function Rate aa= 0 Avg rate = function of TF concentrations Few parameters: • Affinity parameters • Rate parameters ab= 0 ab= 1 “AND” gate “OR” gate ac= 0 ac= 1 = Average Rate ad =1 [Buchler et al, 2003; Setty et al, 2002]
TF activity Trans rate Time Time Models of Regulatory Networks Regulators (activity) TF1 TF2 TF3 Target Genes (trans. rate) G1 G2 G3 G4 G5 G6 G7 ? Predicted rates Observed rates Noise
Expression data TF1 TF2 G1 G2 G3 G4 TF1 TF2 Learning From Data Kinetic parameters Learning + Transcriptionrates Gradient ascent • mRNA decay rates
Biological Databases[YPD] ChIP location [Lee et. al] 7 regulators & 141 target genes Expression data TF1 TF2 Cell cycle gene expression [Spellman et. al] + mRNA decay rates [Wang et al] G1 G2 G3 G4 TF1 TF2 Transcription rates Cell Cycle Experiment Kinetic parameters Learning + Transcriptionrates • mRNA decay rates
2 1 0 Cell Cycle Experiment 17x141 = 2397 Data points 17x7 = 119 Regulator activity values G1 S parameters S/G2 G2/M M/G1 466 parameters input predictions
SWI5 ACE2 G1 G2 G1 G2 FKH1 FKH2 G1 G2 G1 G2 G1 G2 G1 G2 Regulator Activity Profiles • When are they active? Known biology: • SWI4 & MBP1: mid-late G1 • FHK1: S/G2 • FKH2: G2/M • SWI5: M/G1 MBP1 SWI4 Reconstructed activity profiles match direct experimental knowledge
SWI5 Activity mRNA MCM1 Activity mRNA Regulator Activity Profiles • When are they active? • Could we reconstruct thesefrom mRNA profiles? Known biology: • SWI5 is transcriptionally regulated • MCM1 is not mRNA profile Regulator’s own mRNA is not sufficient to reconstruct activity levels
predictions Cell Cycle Experiment How well are we doing? G1 S S/G2 G2/M M/G1 input residue
Expression data TF1 TF2 G1 G2 G3 G4 TF1 TF2 ab initioLearning + Learning Model Learning Kinetic parameters Big assumption: • Network topology is given • Unrealistic, even for well understood systems Challenge: Reconstruct network topology? • Number of regulators • Their joint effect on target genes + Transcriptionrates • mRNA decay rates
TF1 TF2 TF1 TF2 TF1 TF2 G1 G2 G3 G4 G1 G2 G3 G4 G1 G2 G3 G4 TF1 TF2 TF1 TF2 TF1 TF2 G1 G2 G3 G4 G1 G2 G3 G4 G1 G2 G3 G4 TF3 TF1 TF2 G1 G2 G3 G4 How Do We Learn Structure? Standard approach: hill climbing search -17.23 Problem: Scoring structures is costly • Requires non-linear parameter optimization • Impractical on real data -19.19 -23.13
TF1 TF TF2 TF3 G regulators TF4 Time Time Ideal Regulator Method Goal: Consider adding edges Idea: Score only promising candidates Step 2:Search for“similar” regulator Step 1:Compute optimalhypothetical regulator Ideal regulator Activity level Y Target Profile Pred(G|TF) Pred(G|TF,Y)
Ideal regulator TF1 Y TF TF2 TF3 G regulators Pred(G|TF,Y) TF4 Time Time Ideal Regulator Method Goal: Consider adding edges Idea: Score only promising candidates Step 2:Search for“similar” regulator Step 3:Add new parentand optimize parameters Step 1:Compute optimalhypotheticalregulator Parent(s) activity TF2 Crucial point: Choice of similarity measure • Principled approach see [Nachman et al UAI04] • Provides approximation to Δlikelihood Target Profile Predicted(G|TF,TF2)
Y1 G1 Y2 G2 Y3 G3 Y4 G1 G2 G4 G4 Y5 G5 Adding New Regulator Idea: Introduce hidden regulator for genes with similar ideal regulator Ideal regulators TFnew Time New regulator: “centroid” of selected ideal regulators
2 1 0 Ab initio Structure Learning G1 S S/G2 G2/M M/G1 Input rates Curated prior knowledge 466 params ab initio from scratch 461 params
2 1 0 Ab initio Structure Learning G1 S S/G2 G2/M M/G1 Input rates Curated prior knowledge 466 params ab initio from scratch 461 params
Significant target overlap & correlated activity H2 Significant target overlap & weak correlation H4 SWI4 SWI5 0 20 40 60 80 100 120 Regulators: ab initio vs. curated SWI4 MBP1 ACE2 FKH1 SWI5 MCM1 FKH2 regulators curated target genes ab initio regulators H4 H5 H6 H2 H3 H1 H7 MBP1 H1 FKH2 H3
Regulators: ab initio vs. curated SWI4 MBP1 ACE2 FKH1 SWI5 MCM1 FKH2 regulators curated • Significant agreement with “known” topology • Both in structure & dynamics • Improved predictions target genes ab initio regulators H4 H5 H6 H2 H3 H1 H7
TF1 TF2 TF1 TF2 G1 G2 G3 G4 G1 G2 G3 G4 TF1 TF2 Conclusions • Realistic model, based on first principles • Learning procedure • Reconstruct unobserved activity profiles • Reconstruct network topology • Insights into • Structure & Dynamics • Function Network (prior knowledge) + Model Learning Kinetic parameters + Transcription rates
TF1 TF2 TF3 G1 G2 G3 G4 G5 G6 G7 External perturbations Future Directions • Prior knowledge • ChIP location • Cis-regulatoryelements Internal feedback